Hit enter to search or ESC to close

Data Engineering and Visualization Solutions We Provide

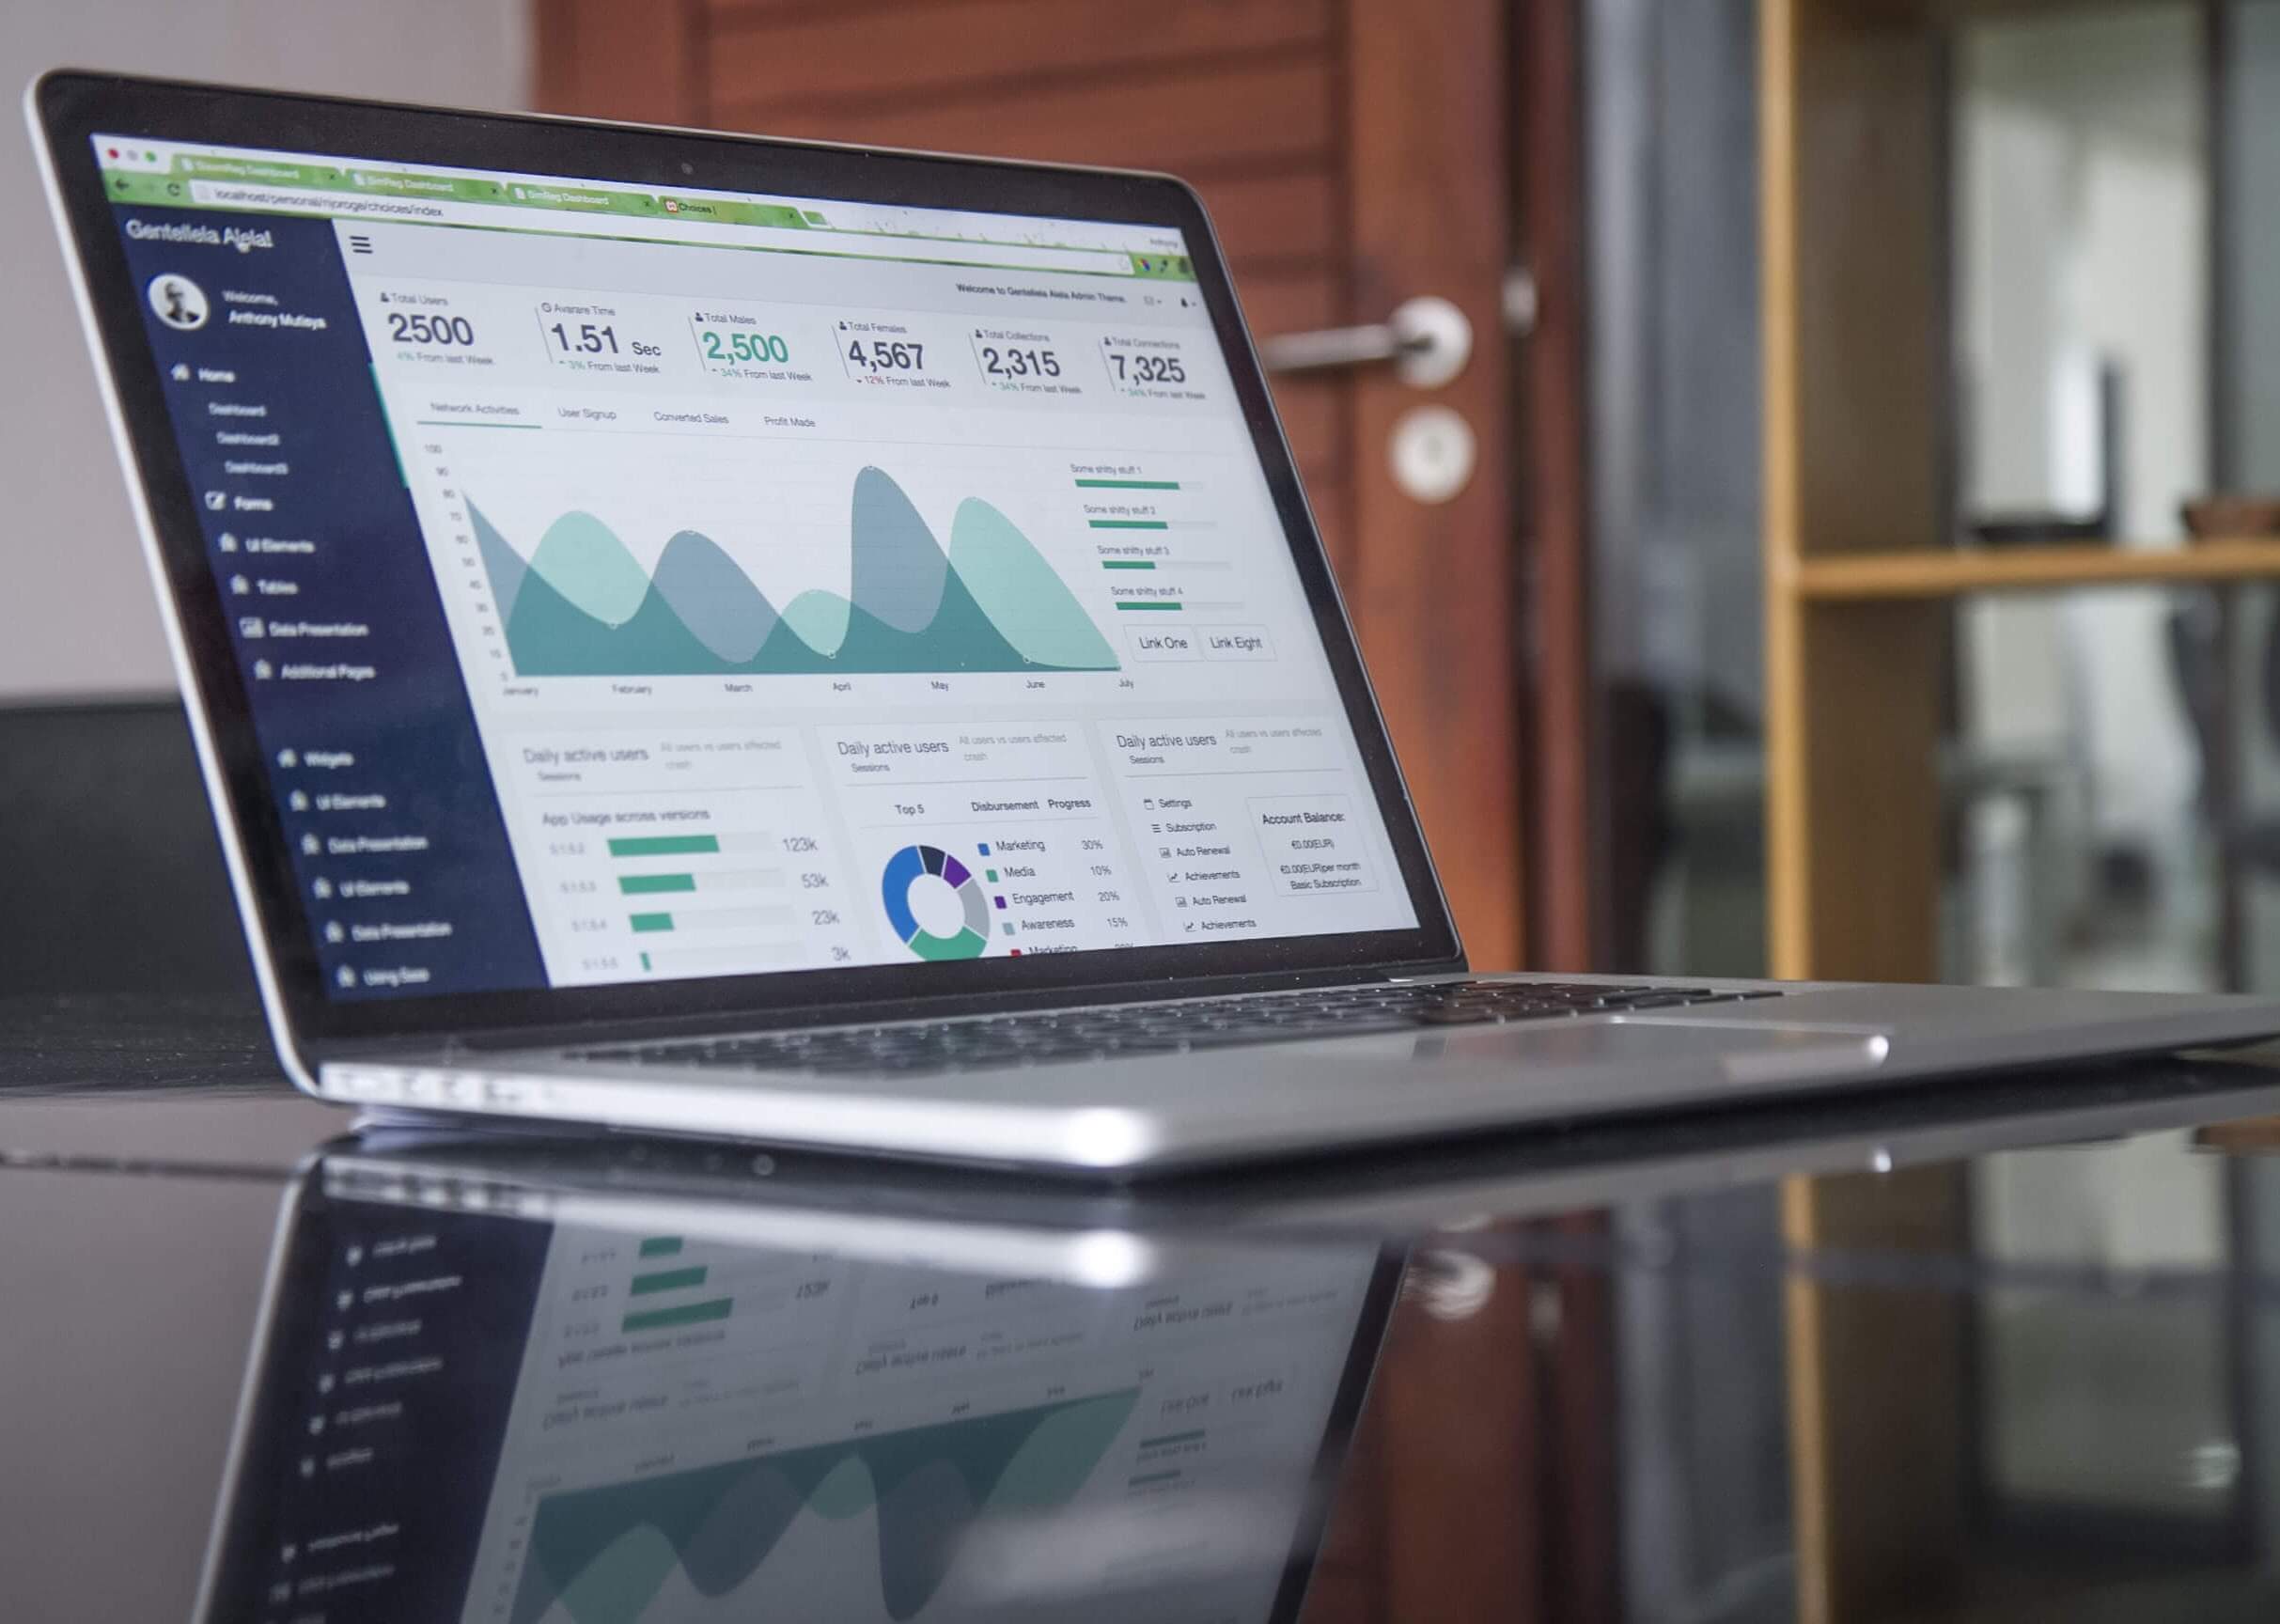
Financial Reporting & BI

Key platform to display organization’s financial status, business analytics metrics, KPI’s and significant data points for an organization

HR Dashboards

Reporting tool to reflect key HR metrics for the HR department to take decisions on resource management and performance

Marketing Dashboards

Reporting tool to display marketing analytics, metrics, KPI’s with data visualization. Designed to provide organizations a real time view of marketing performance

Sales Forecasting

Key platform to display organization’s financial status, business analytics metrics, KPI’s and significant data points for an organization

Spend Reporting & forecasting

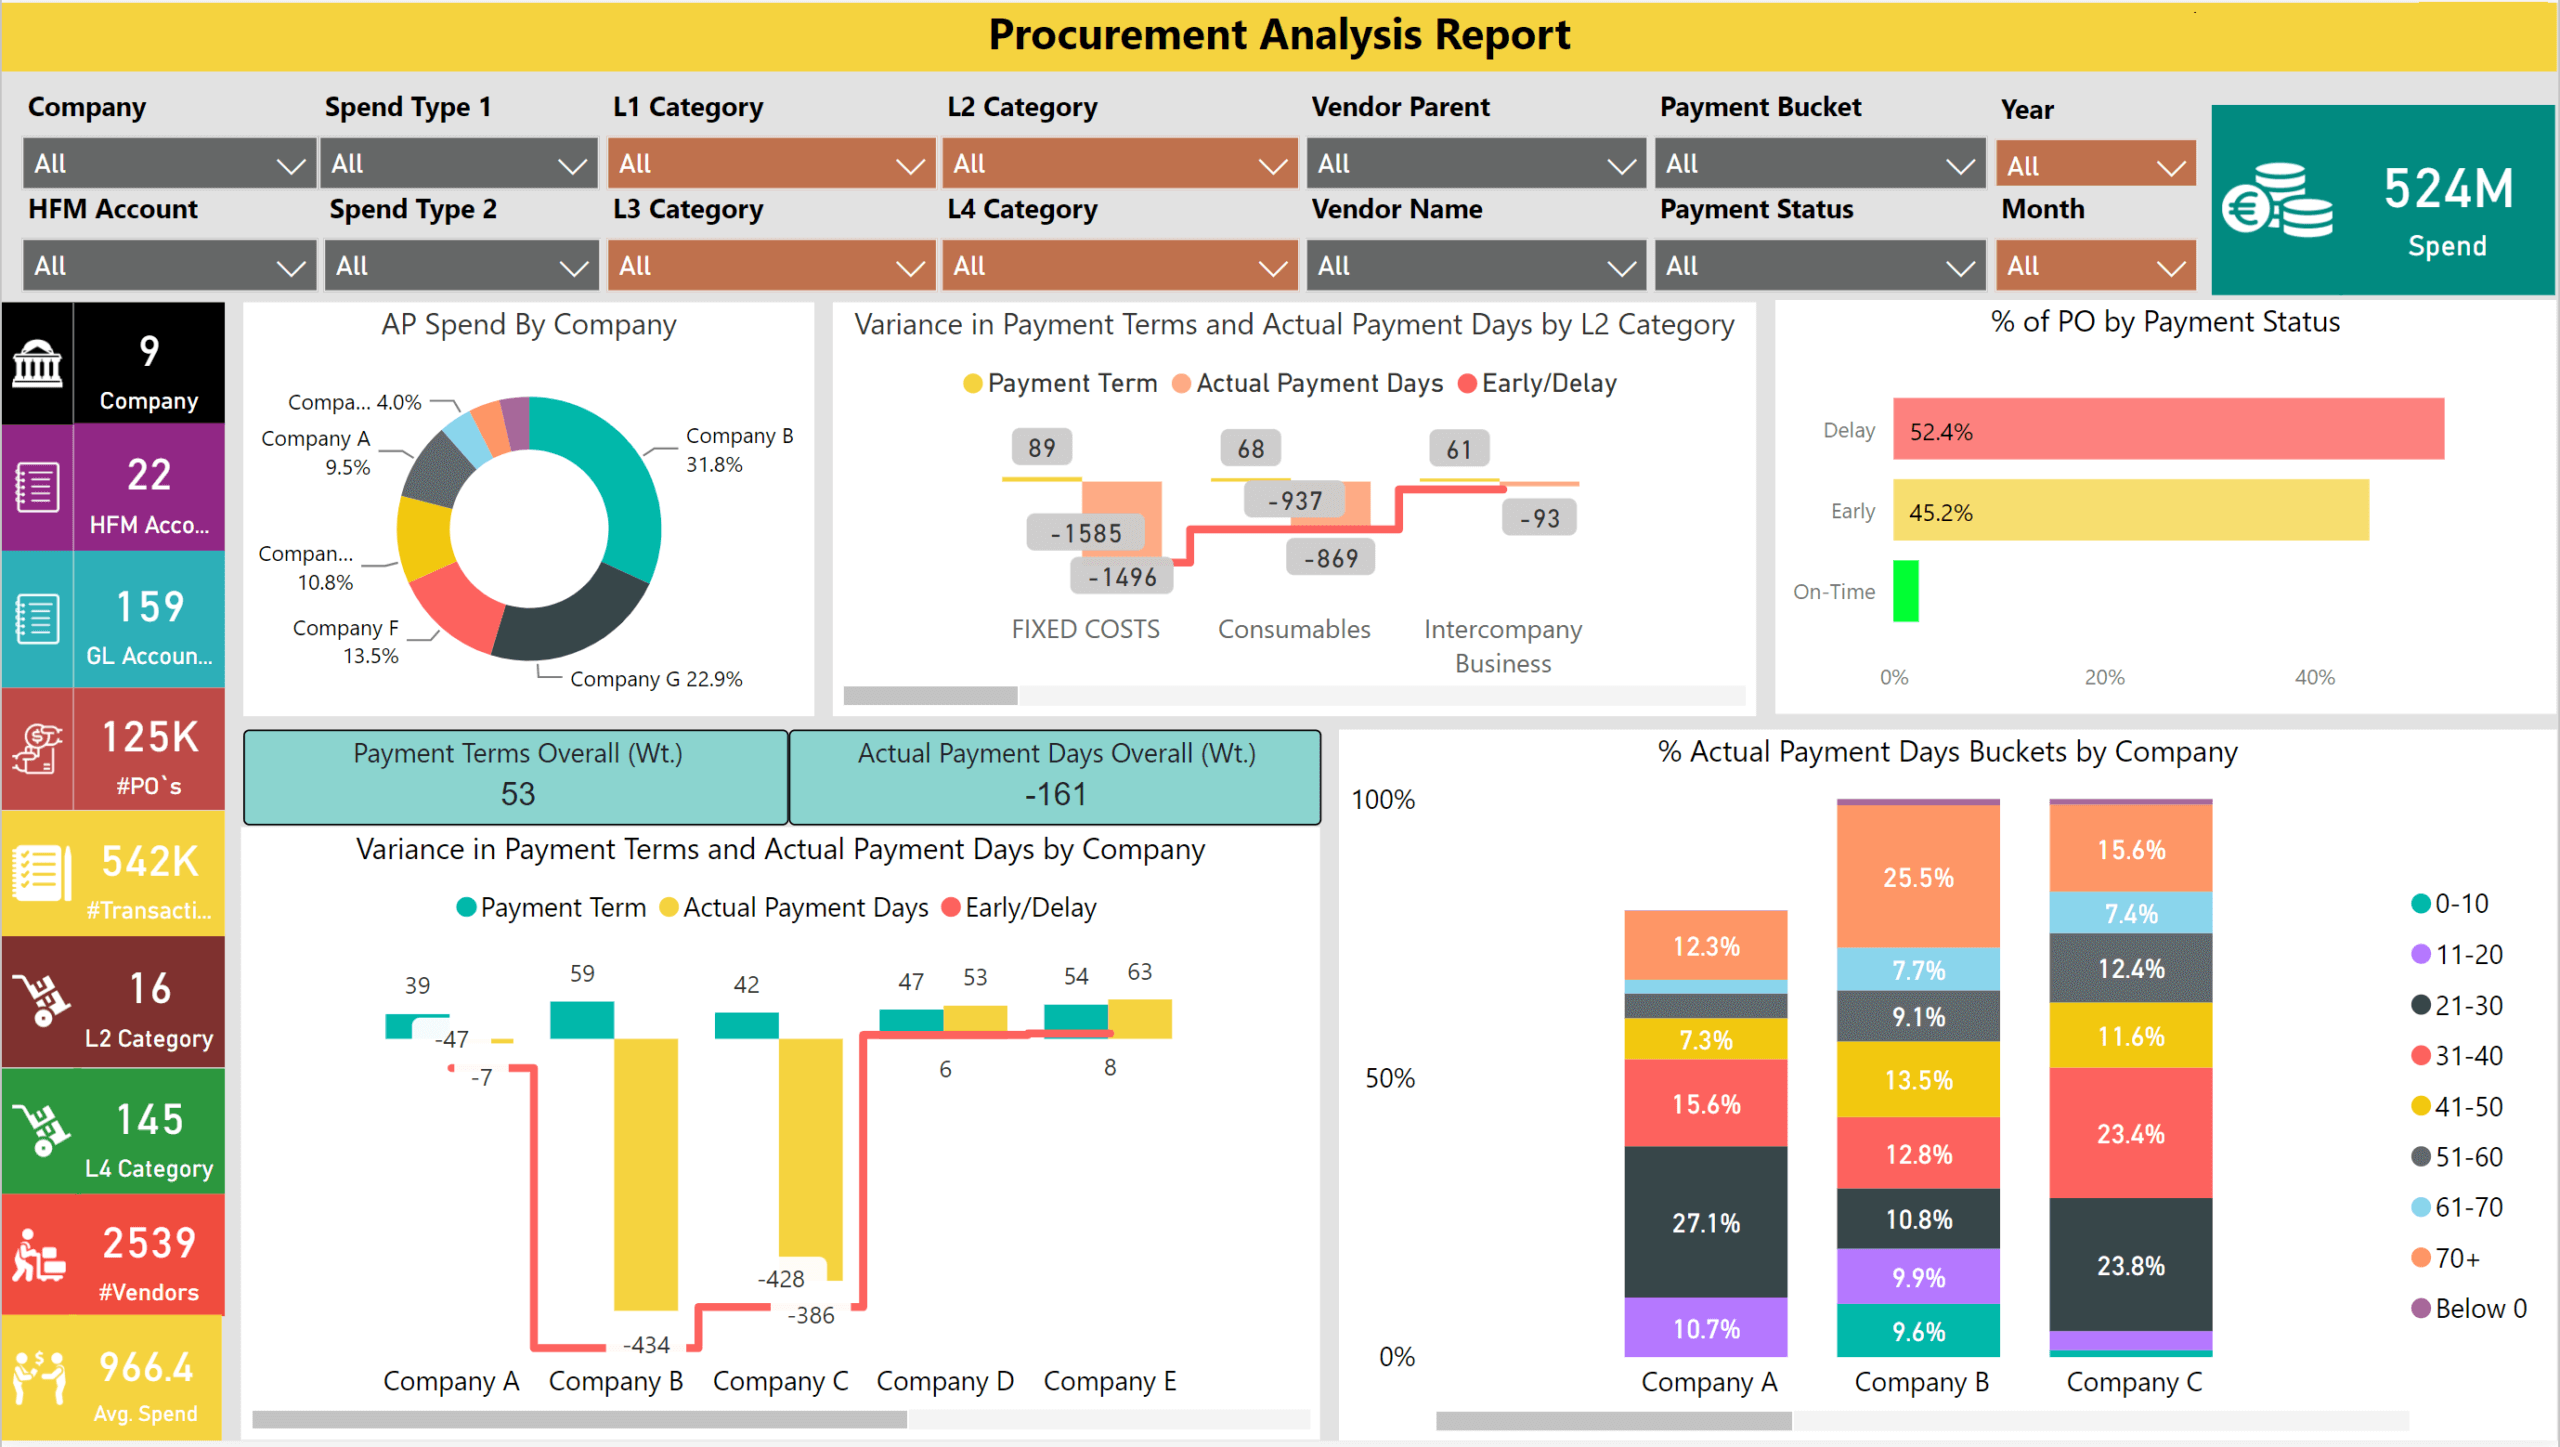
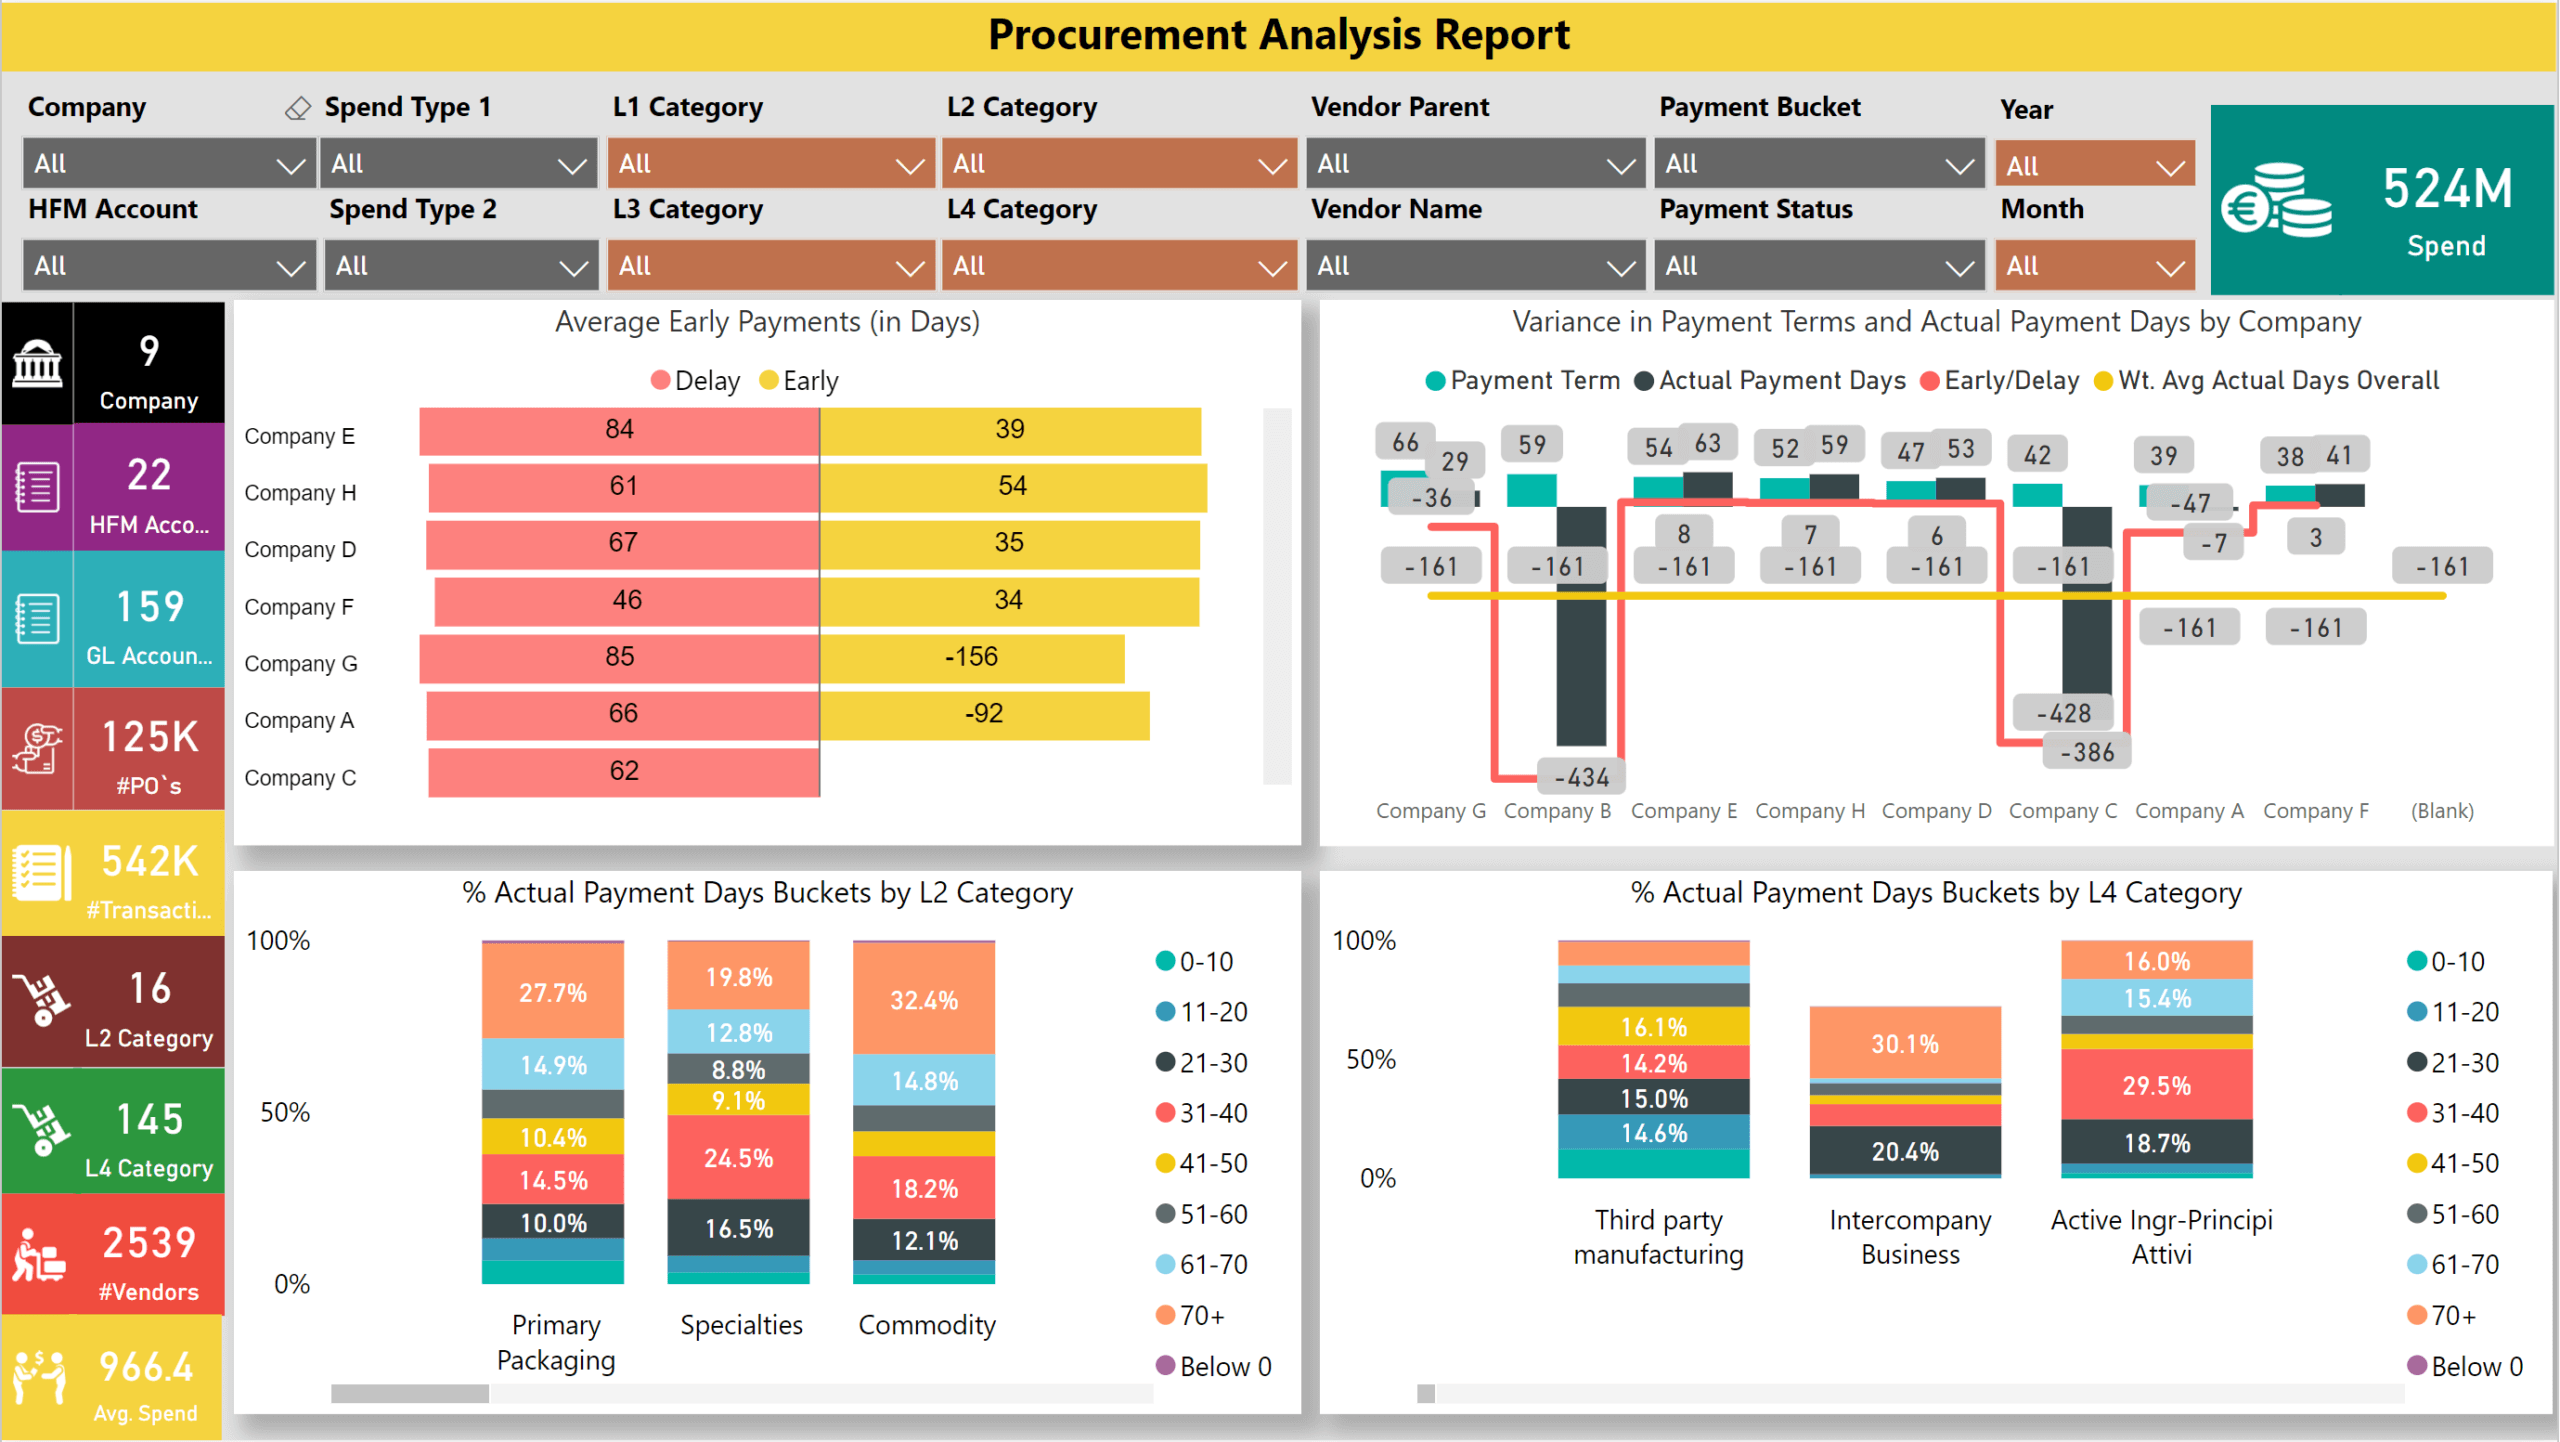
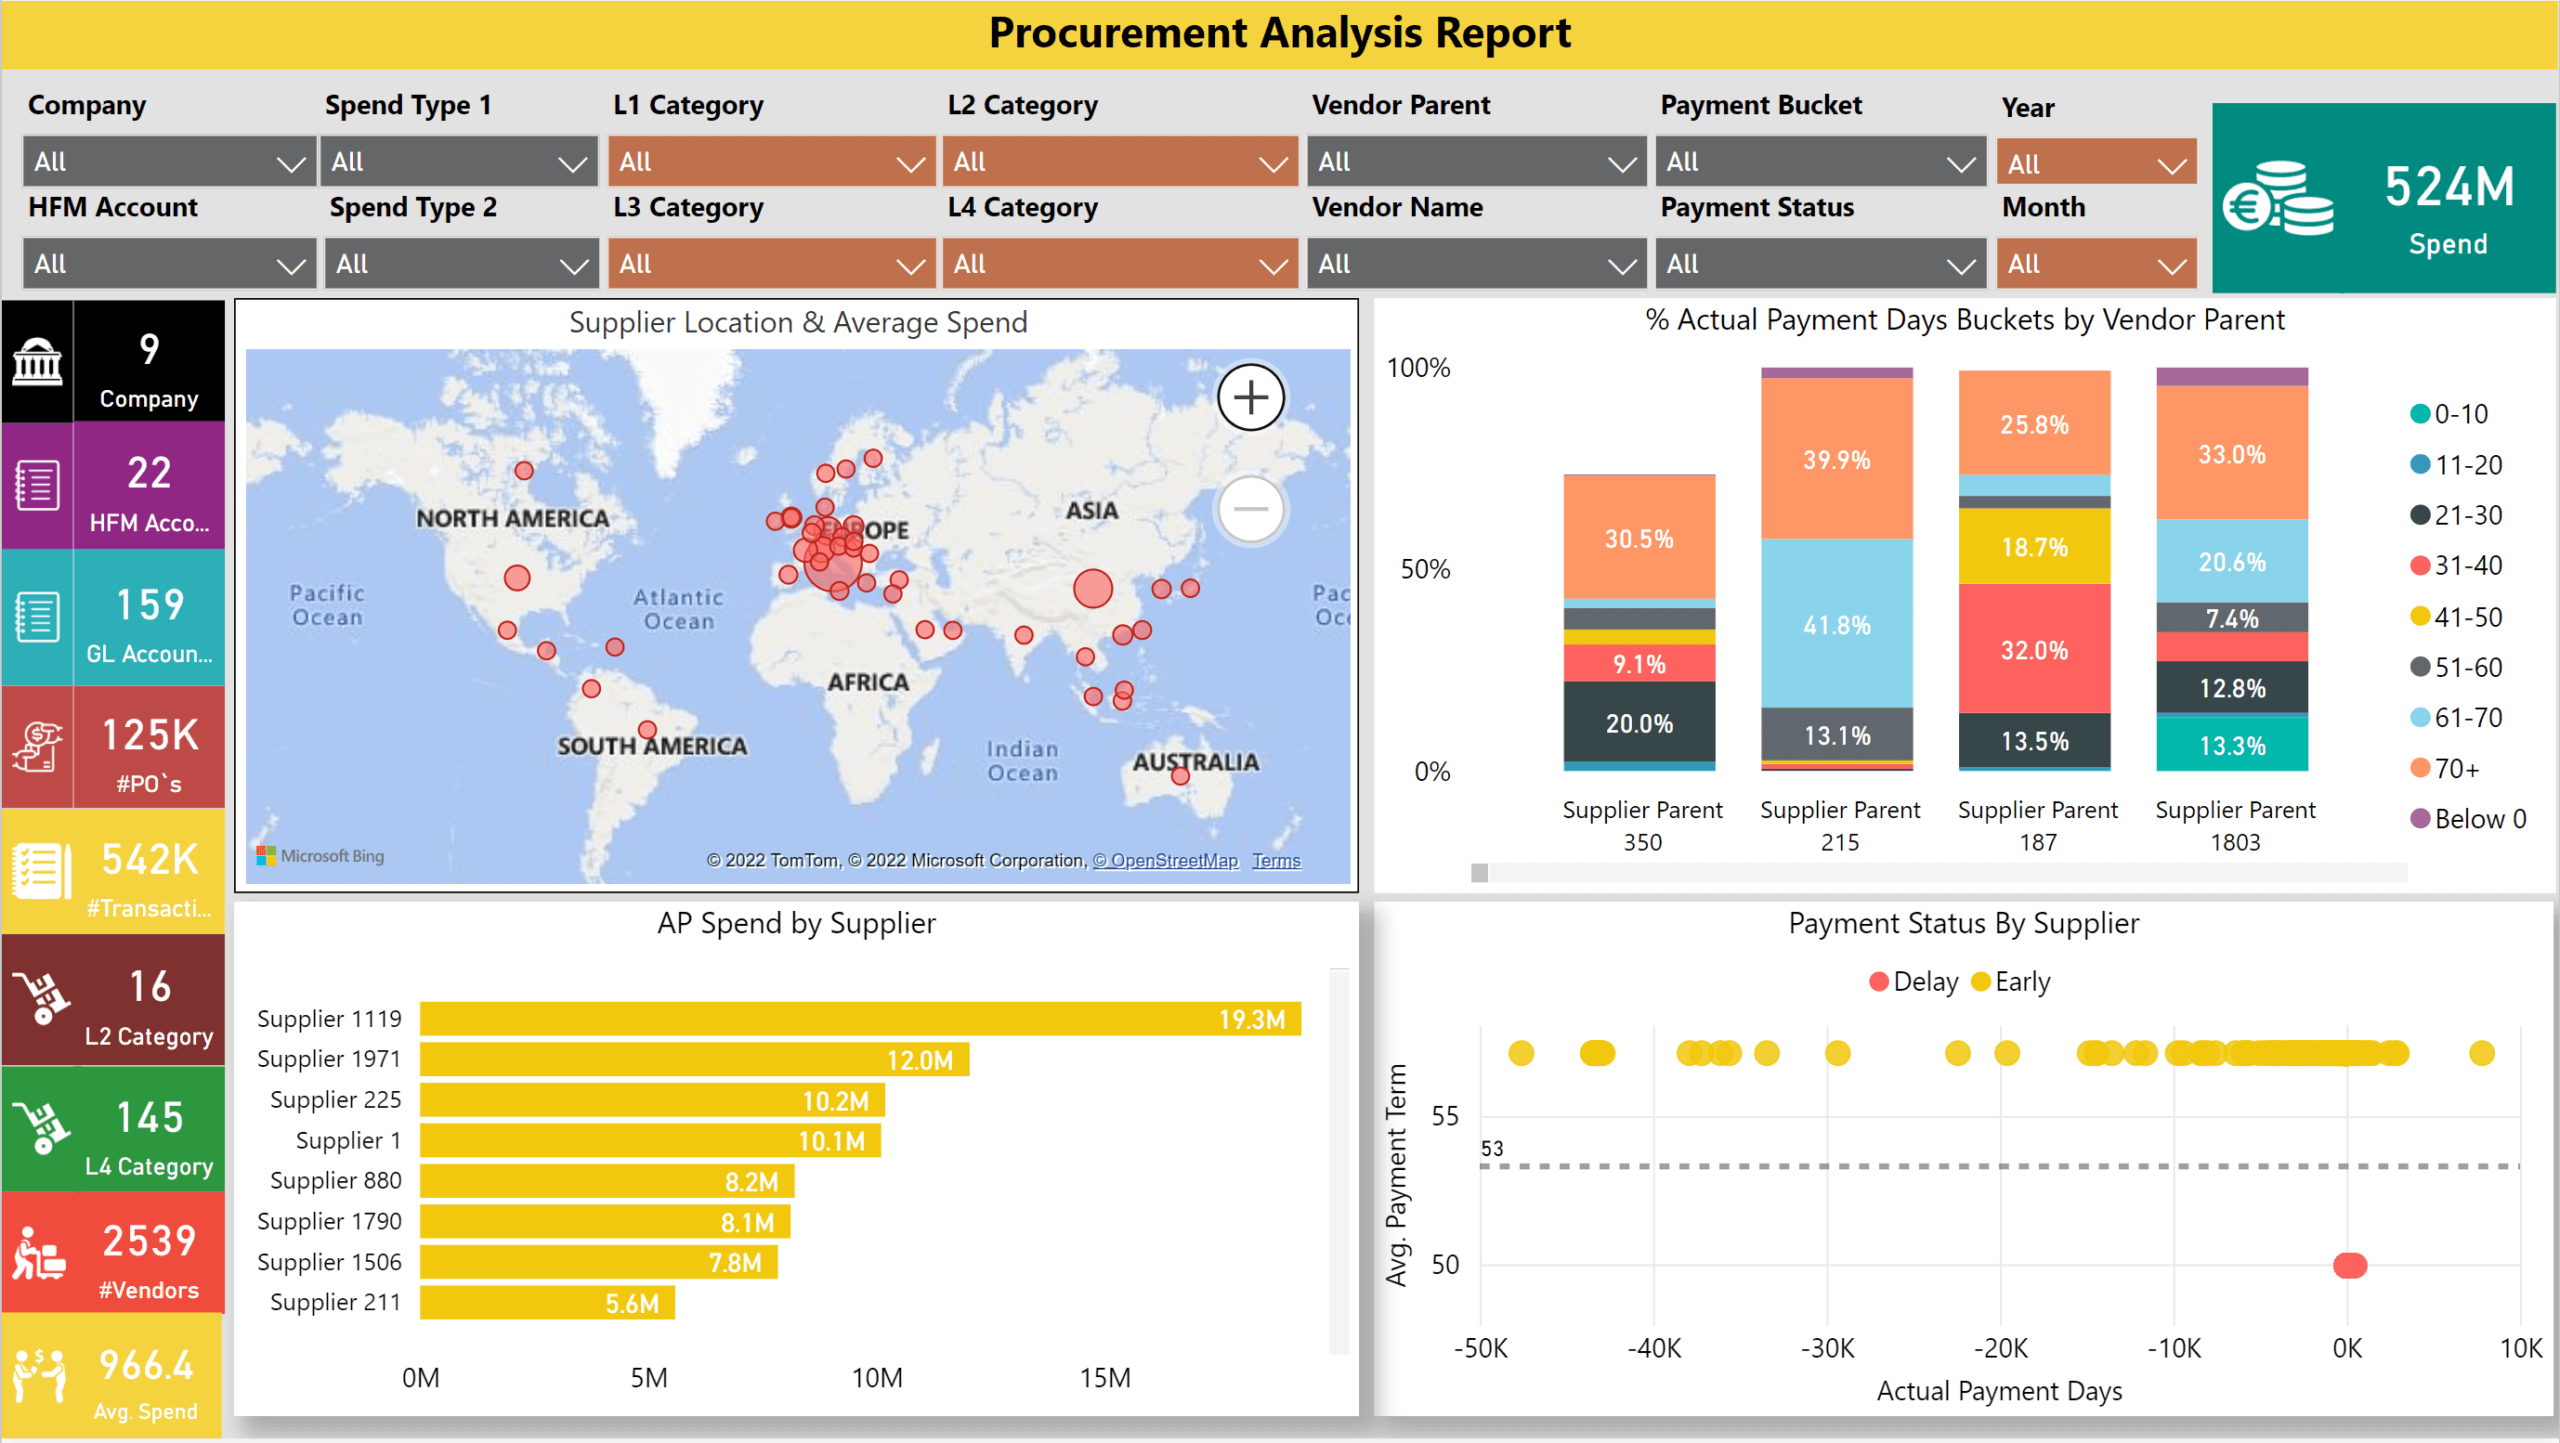
Analyze & process spend data to measure against KPI’s and obtain complete visibility of their past, current and future procurement trends

Supplier Scorecards

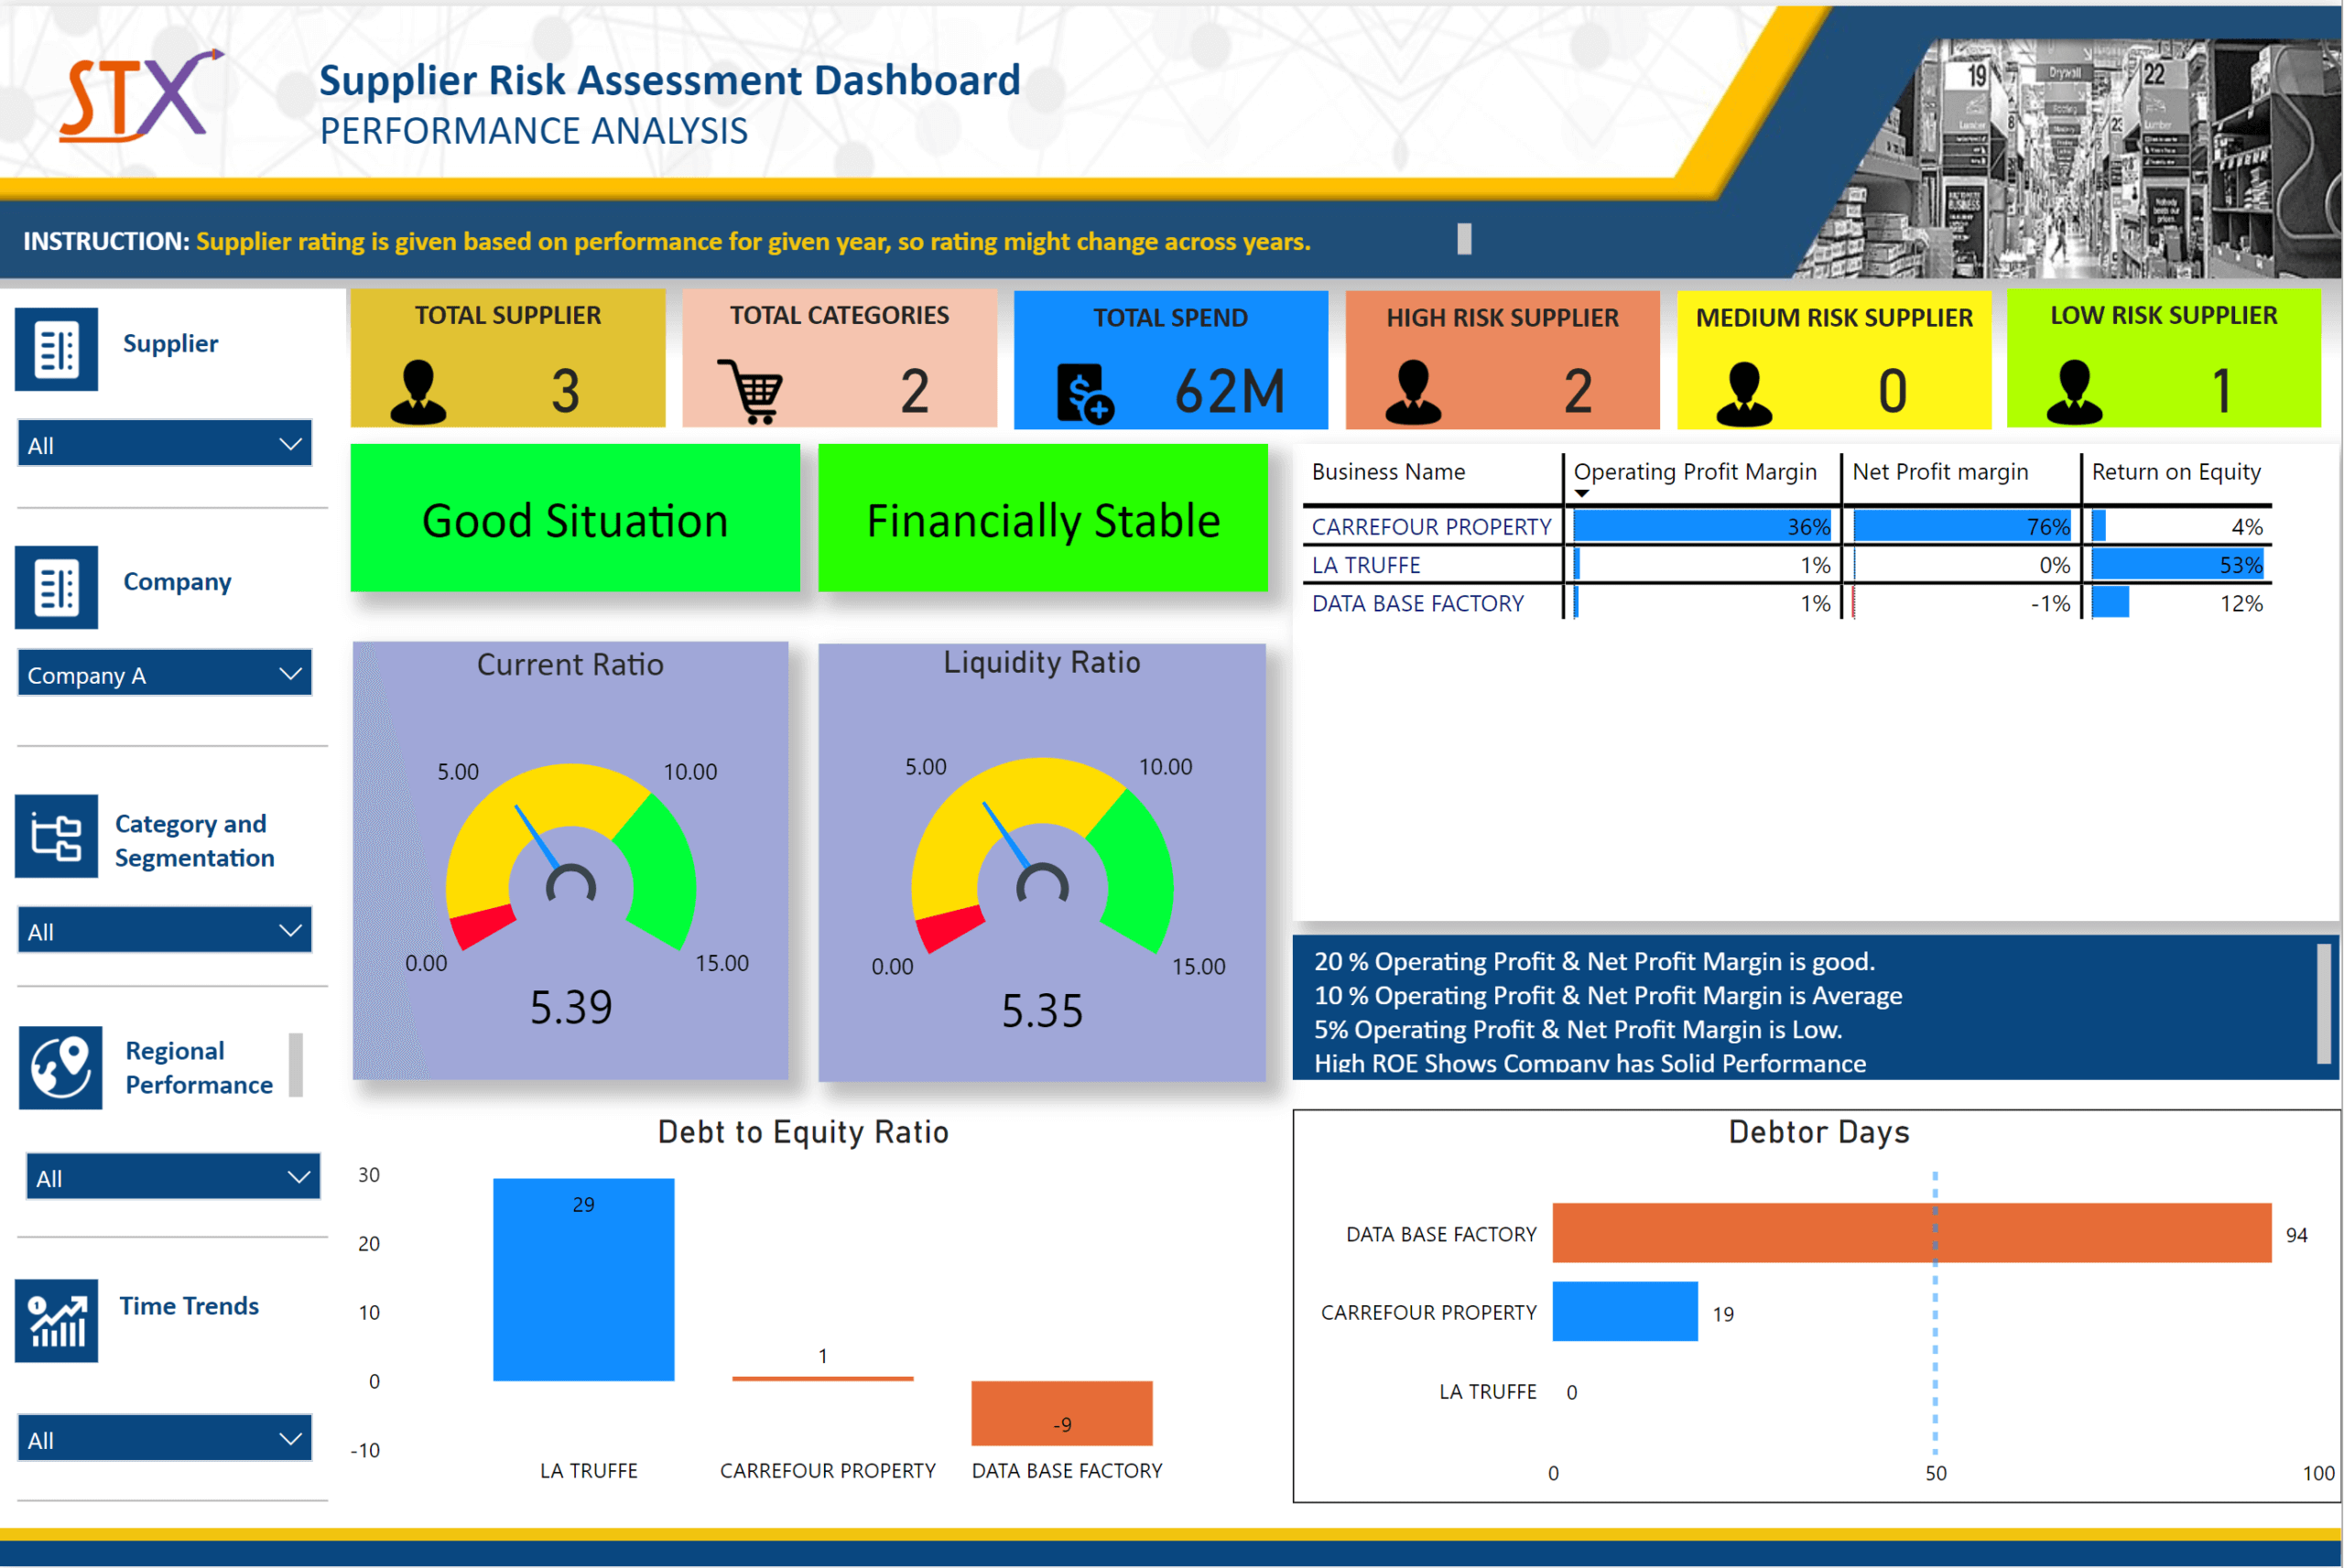
Evaluation tool to assess supplier performance. Helps to track quality, delivery, risk, response time for each supplier

Competitor Scorecards

A scoring model for assessment of competitors to identify key players, feature set and products to perform comparative analysis

Why Choose STATXO as Your Premier Data Engineering and Visualization Solutions Provider?

In-depth Multi-Sector Experience

Our team has experience in delivering 3000+ data management projects across more than 10 sectors globally

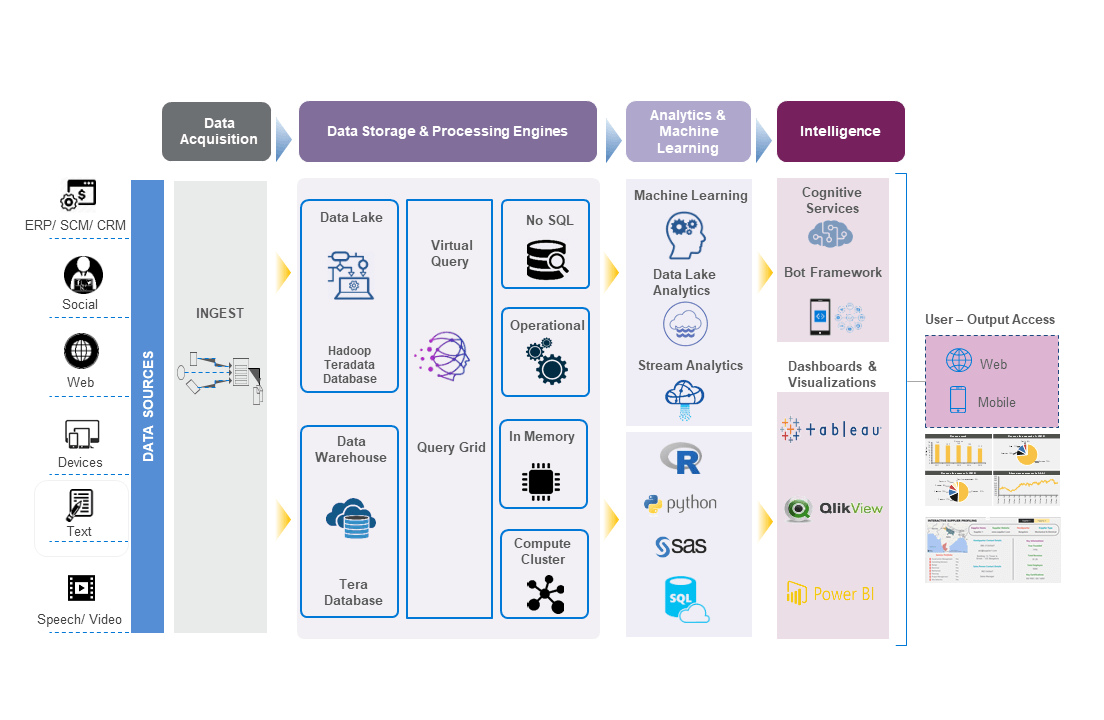
Big Data Architecture

Designed framework to deal with complex data sets that are big in size and unstructured. Our data transformation approach help clients in migrating from existing systems to Big Data environment

Evaluate Big Data Tools & Technology

We continuously evaluate the big data tools, analytics platforms, machine learning algorithms & technology to recognize the best combination for different client requirements before establishing the big data analytics strategy

Visualization and Dashboarding

Helps to penetrate into the real time data and organize it in a way that is easily understandable and useful. Dashboarding works with various data sets to process, extract data and make it accessible

Innovative Big Data Engineering & Visualization Framework: Integrating Advanced Analytics with Visualization Tools

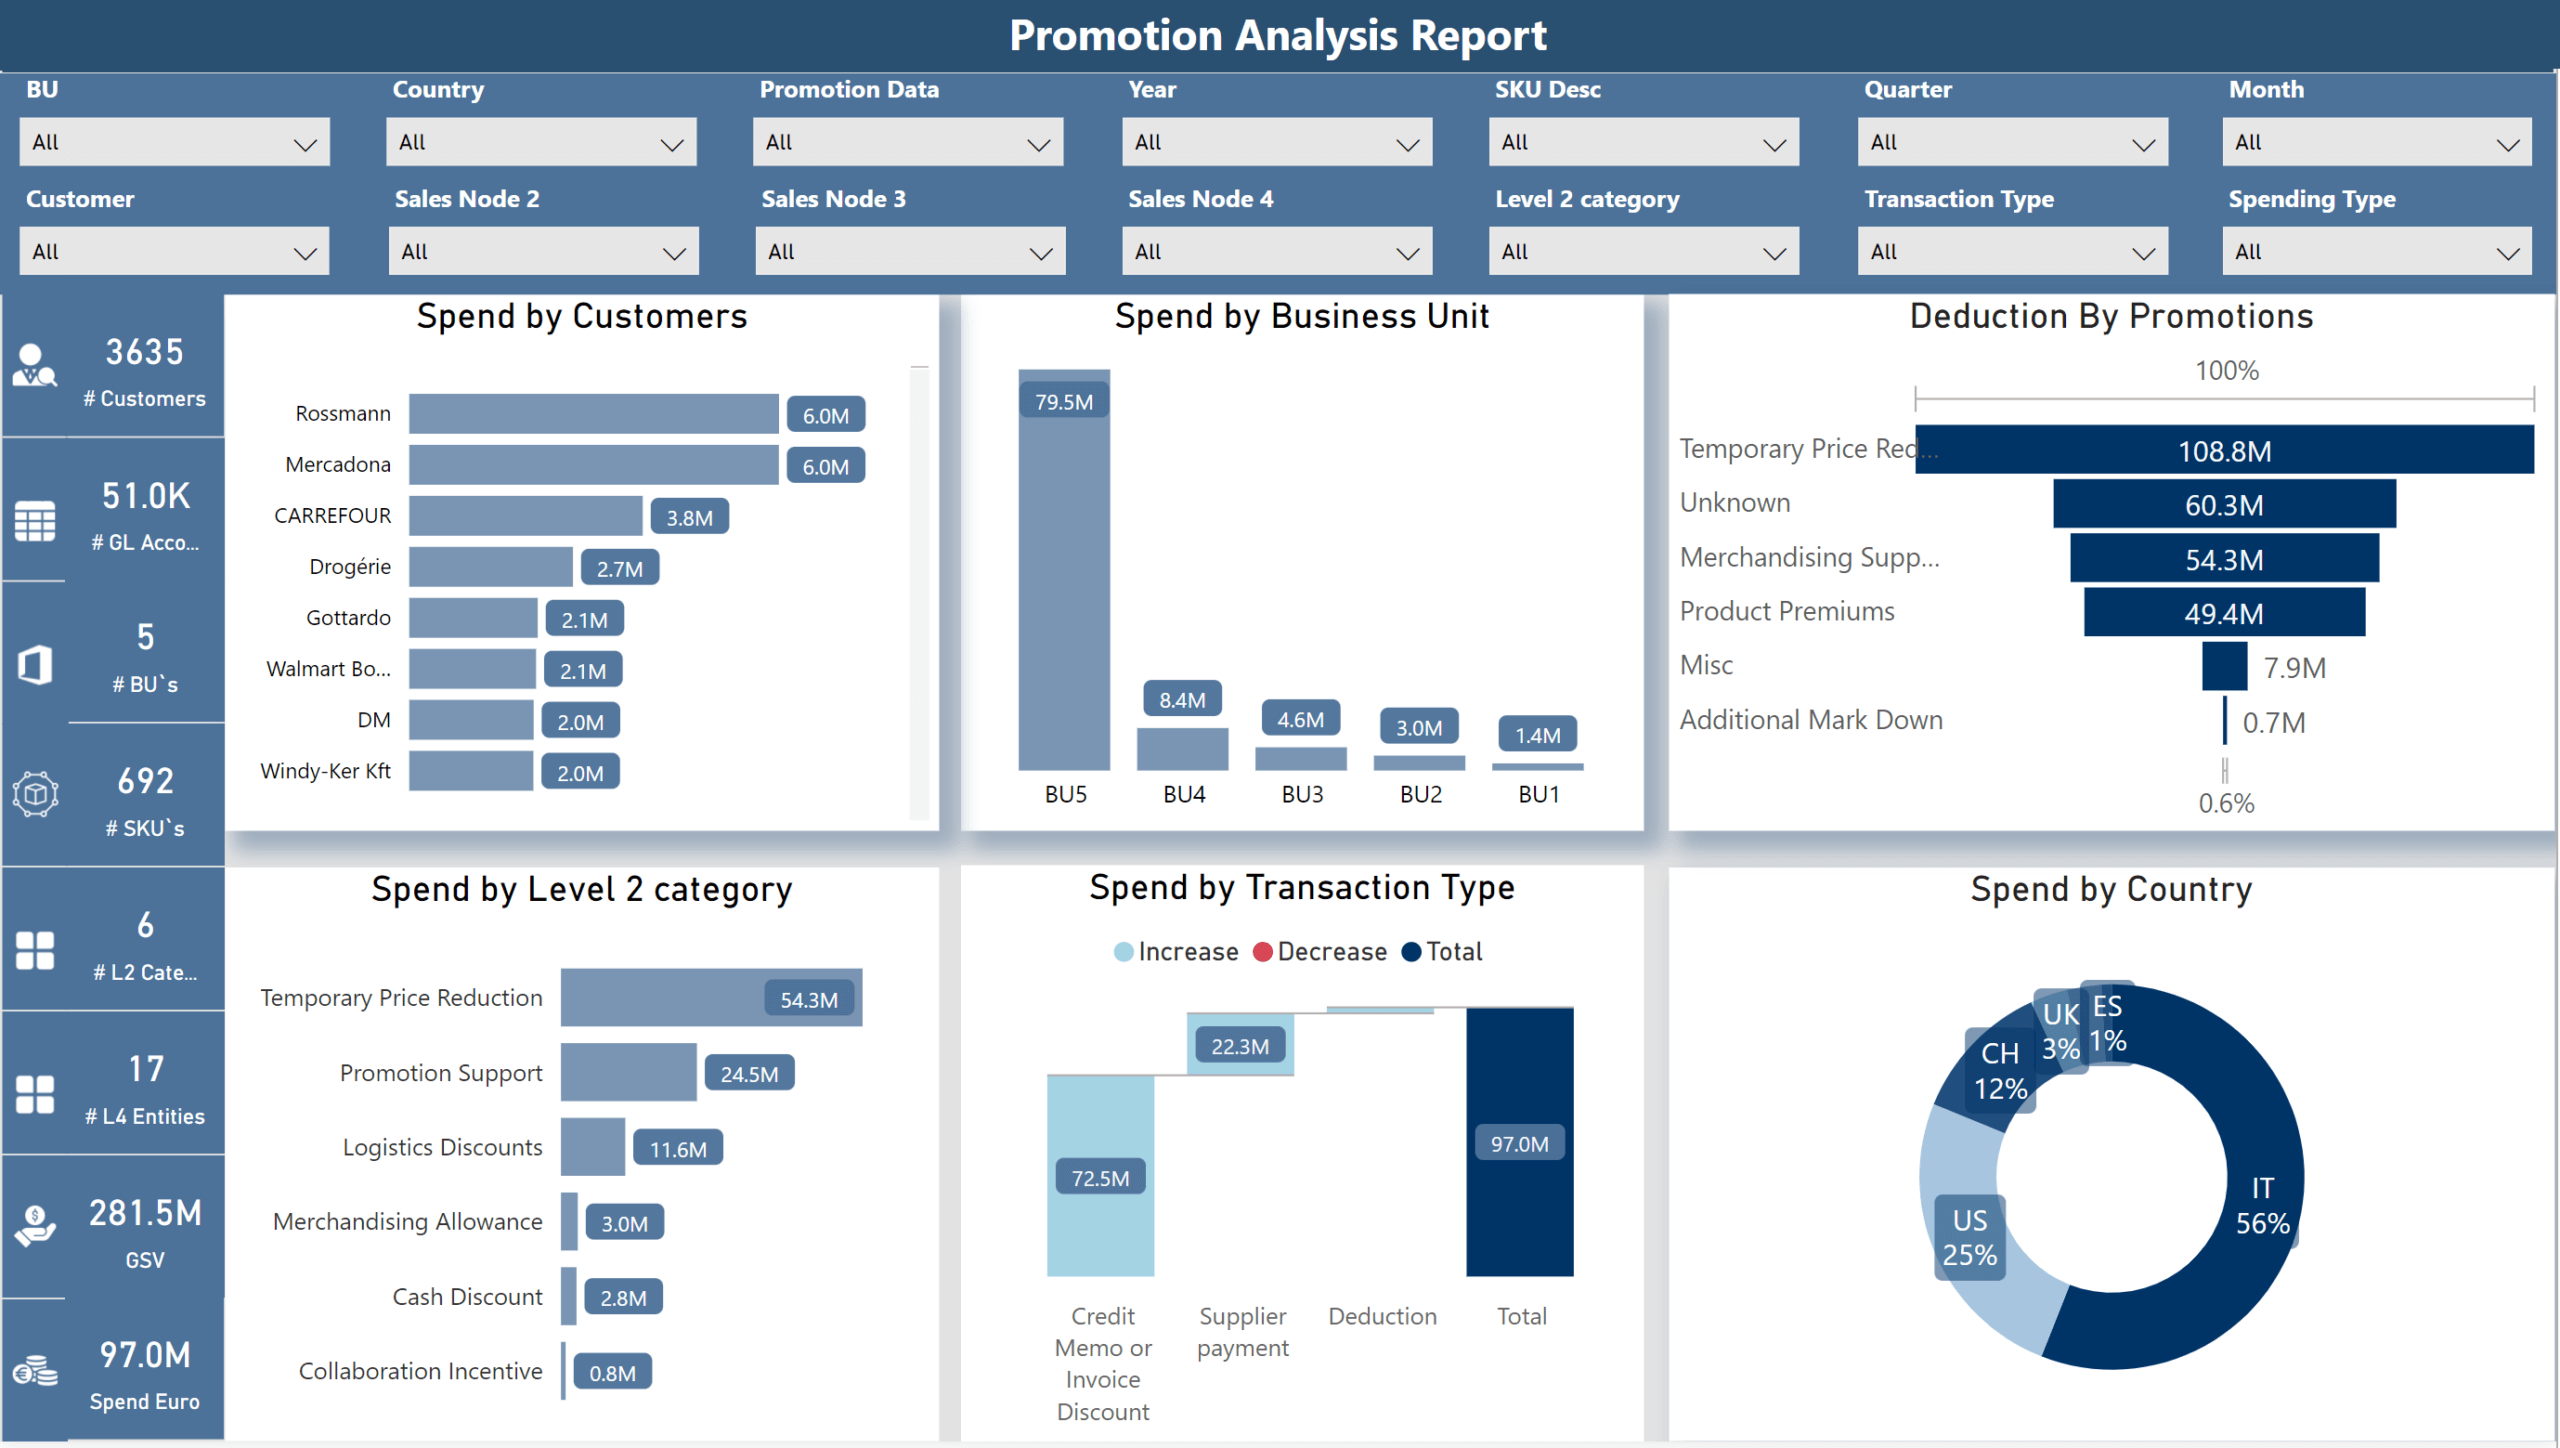
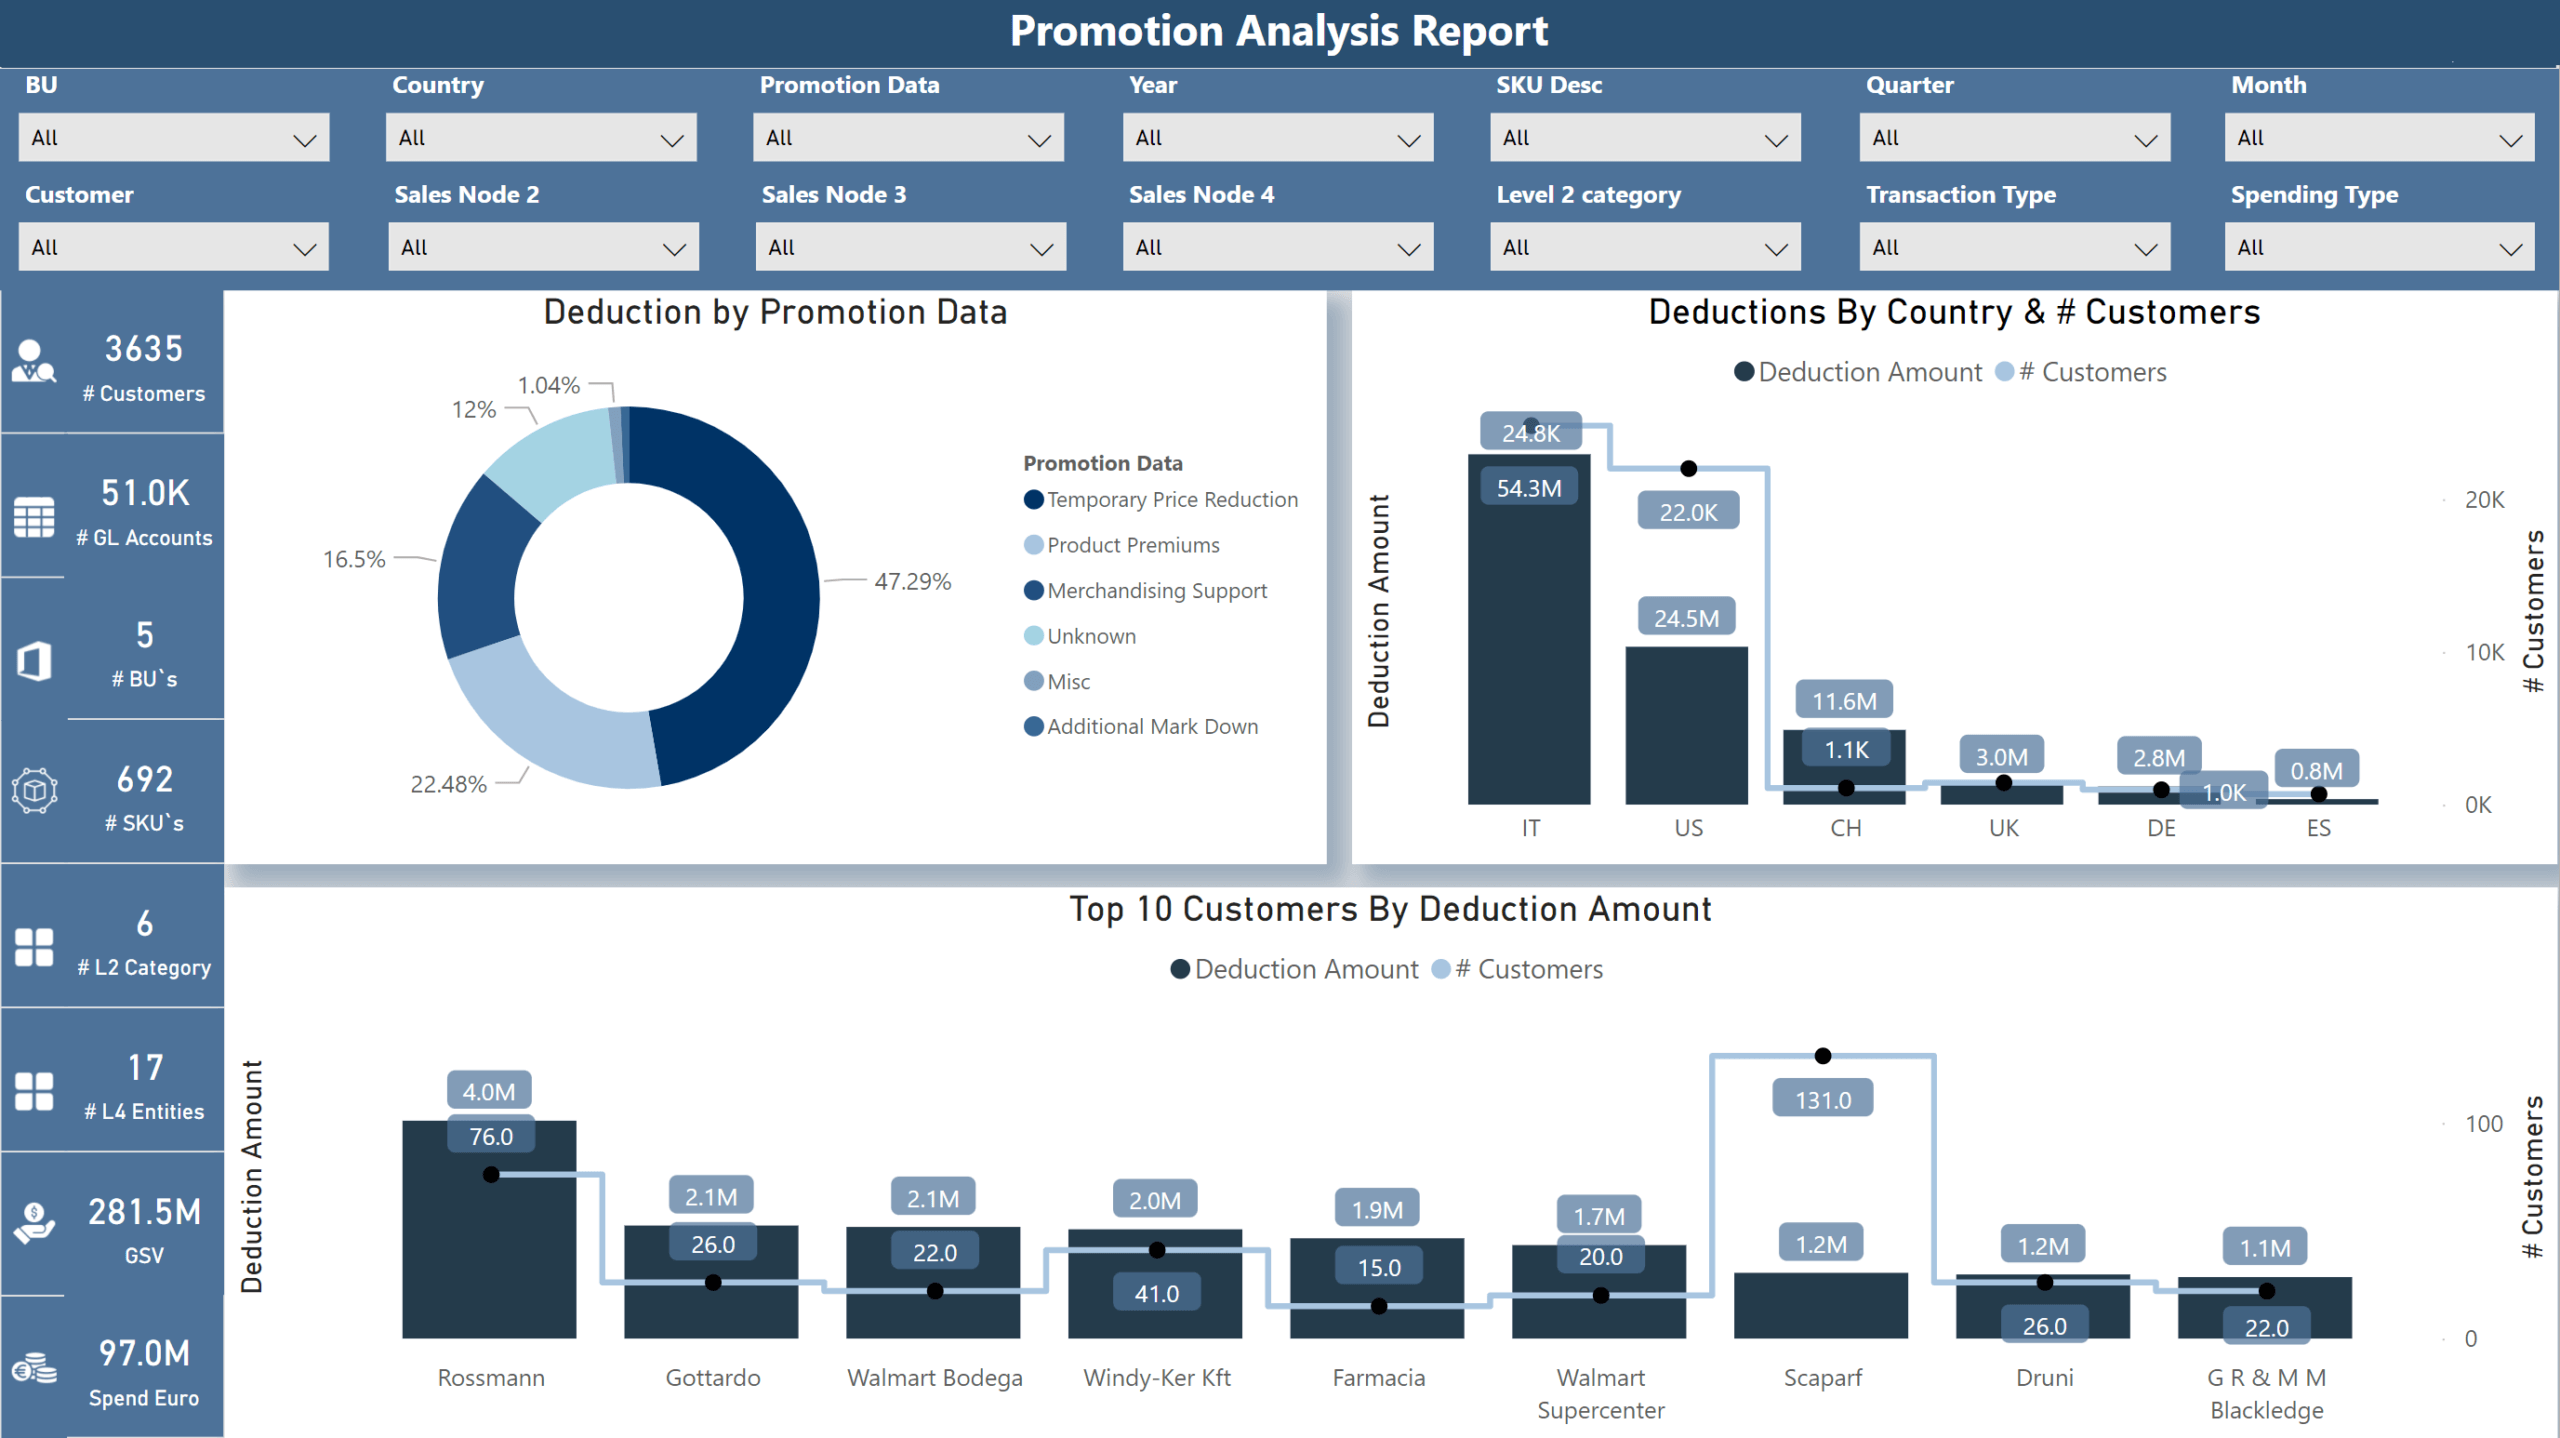
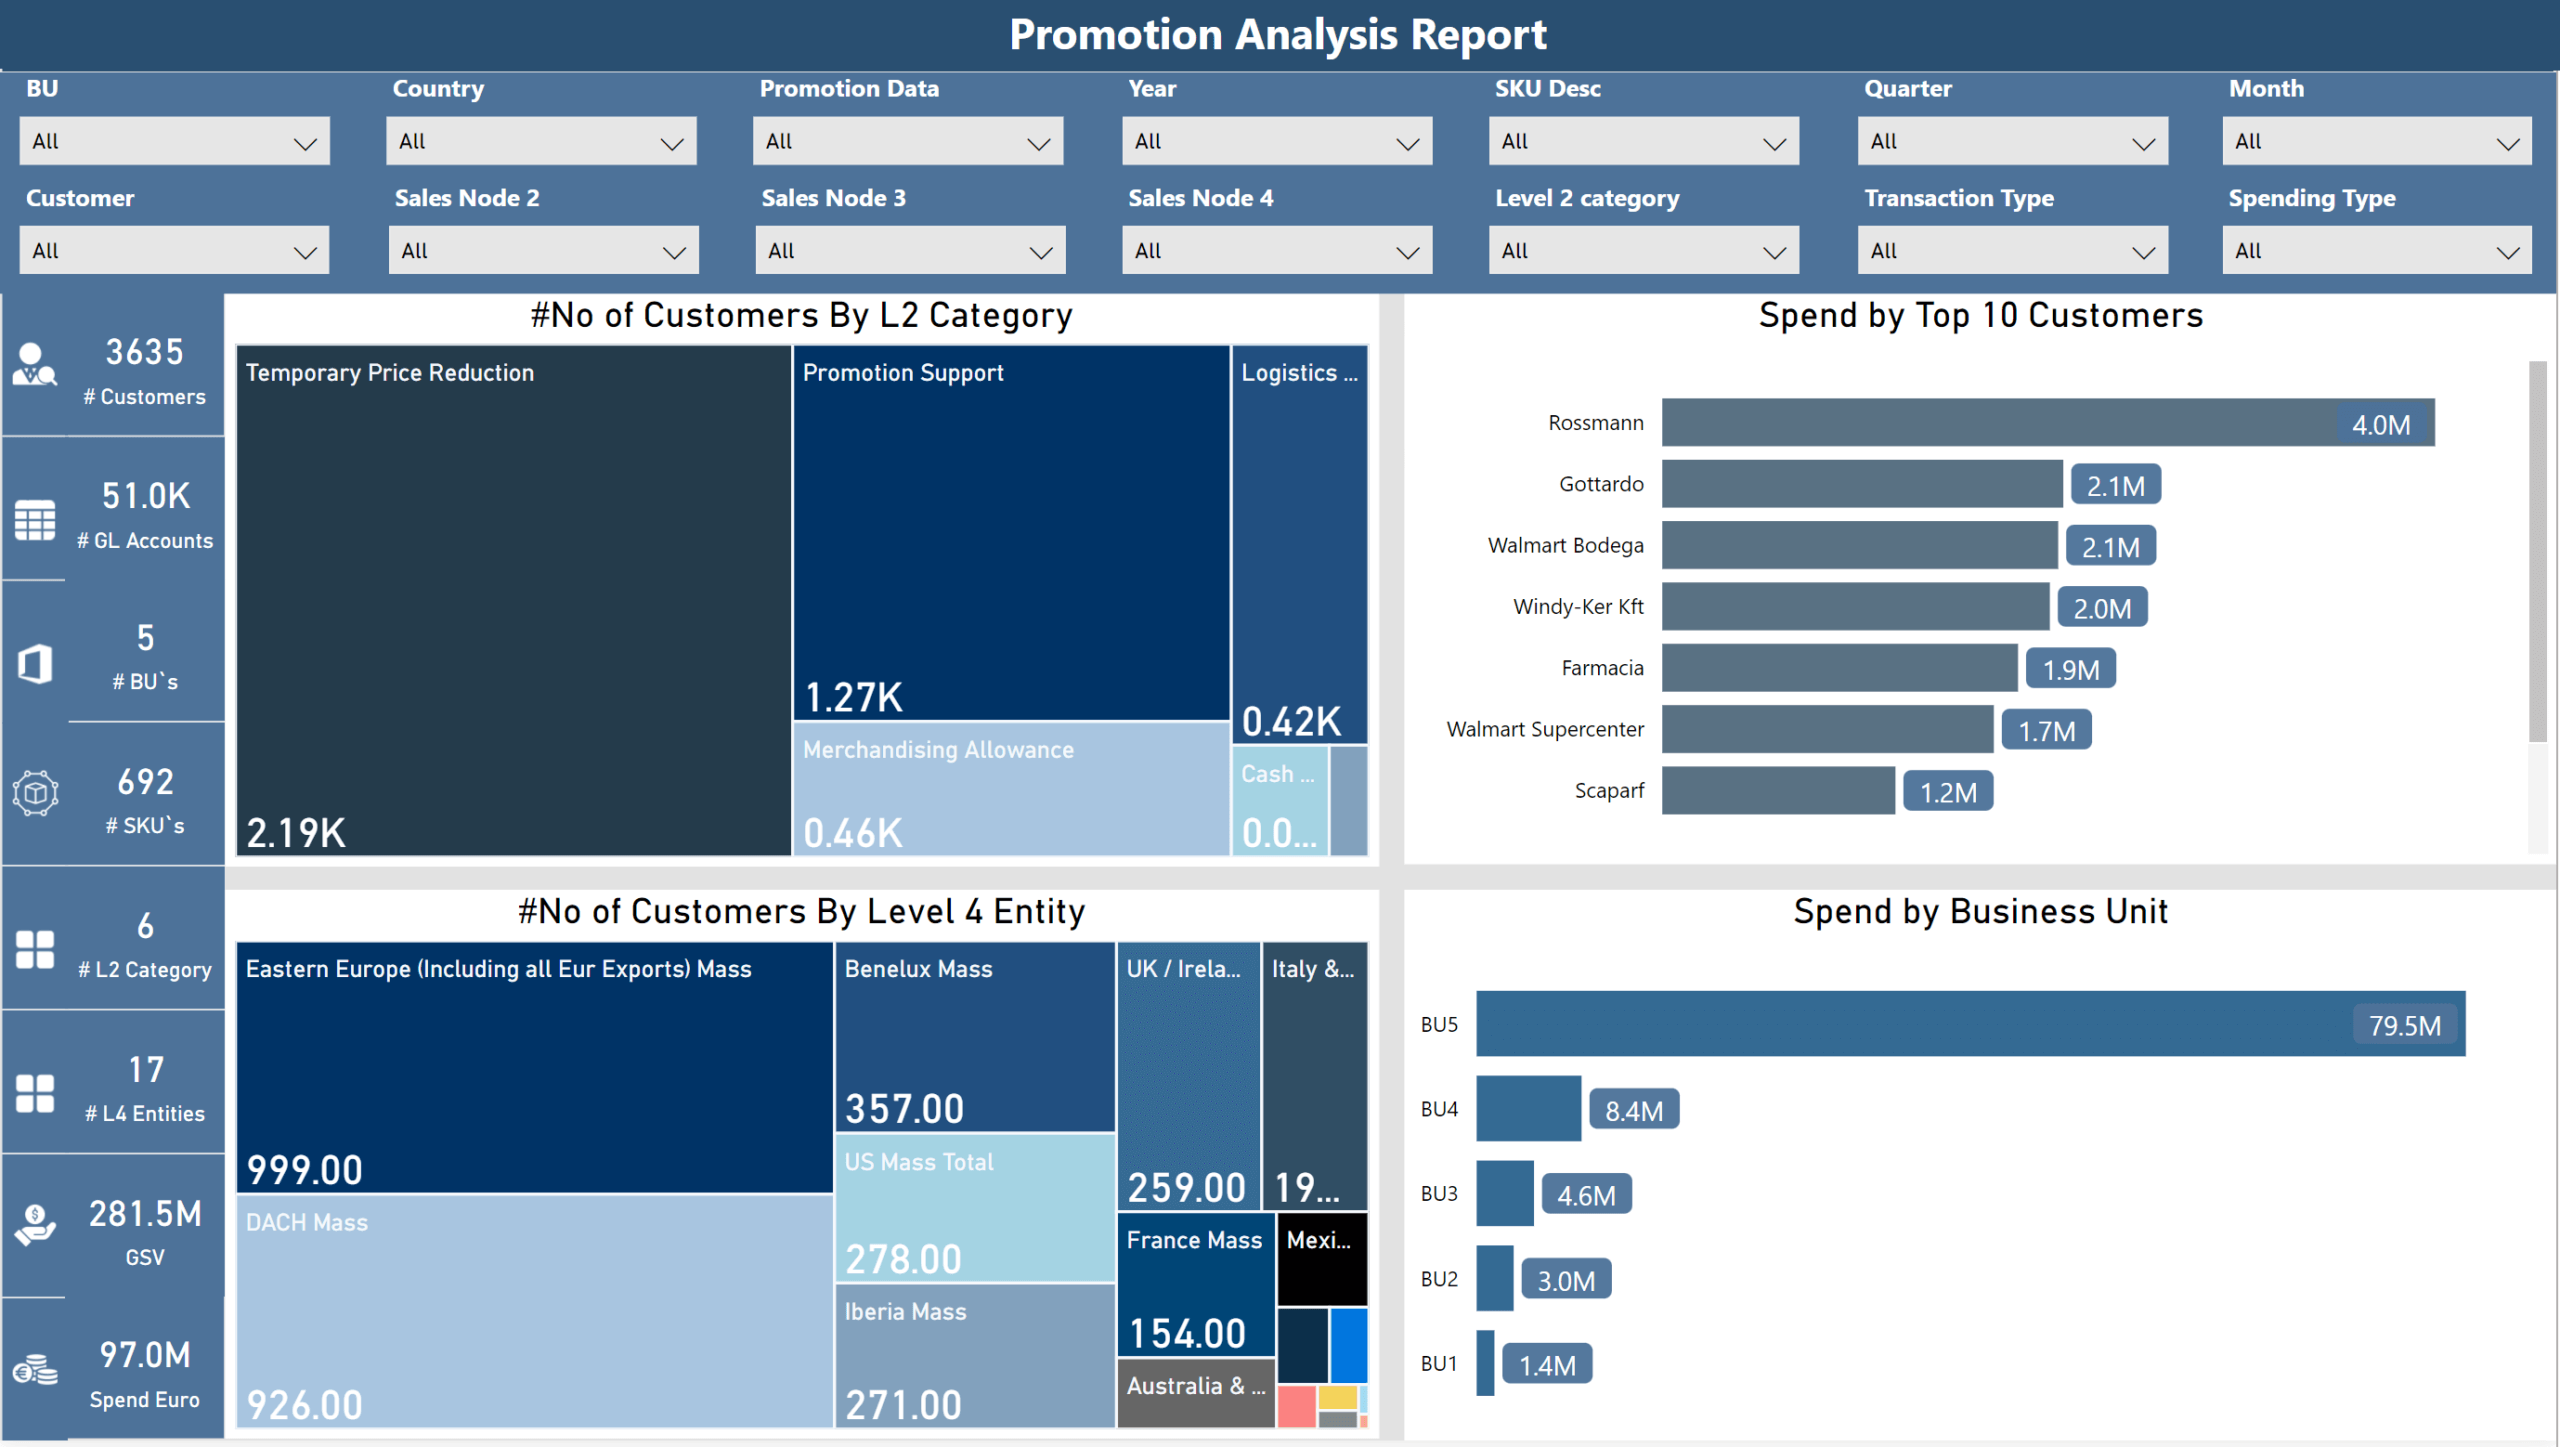
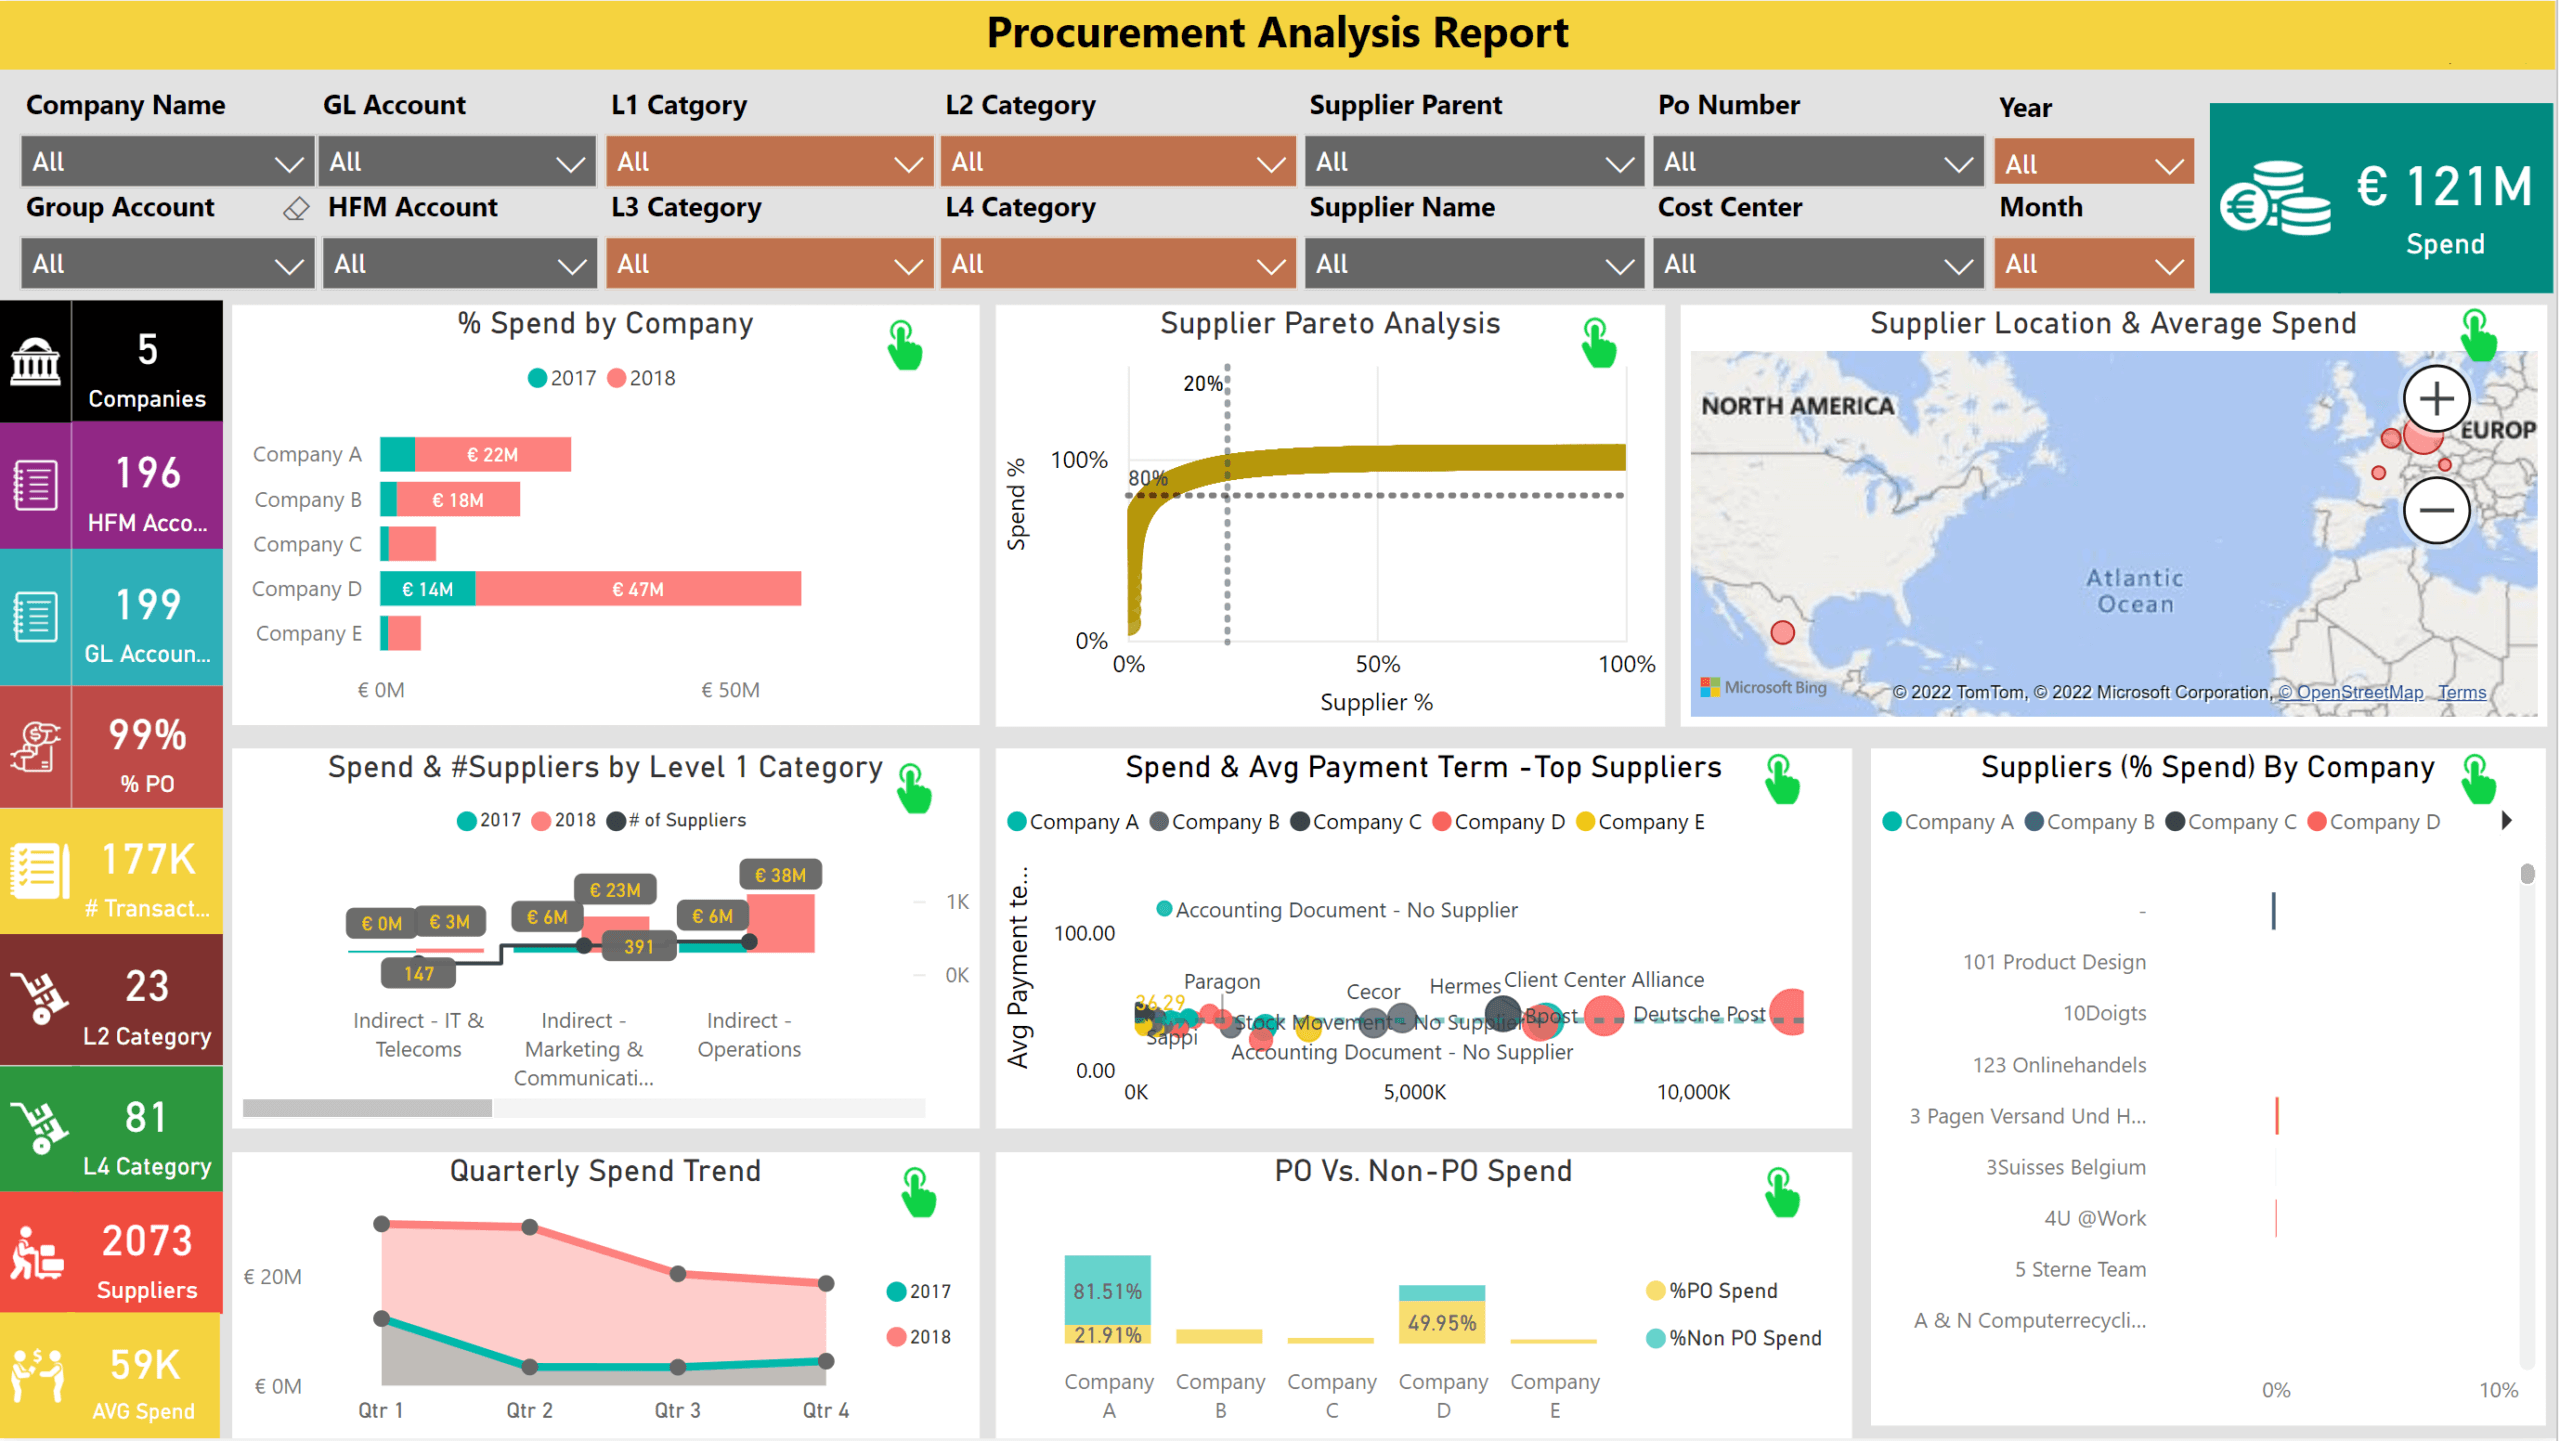
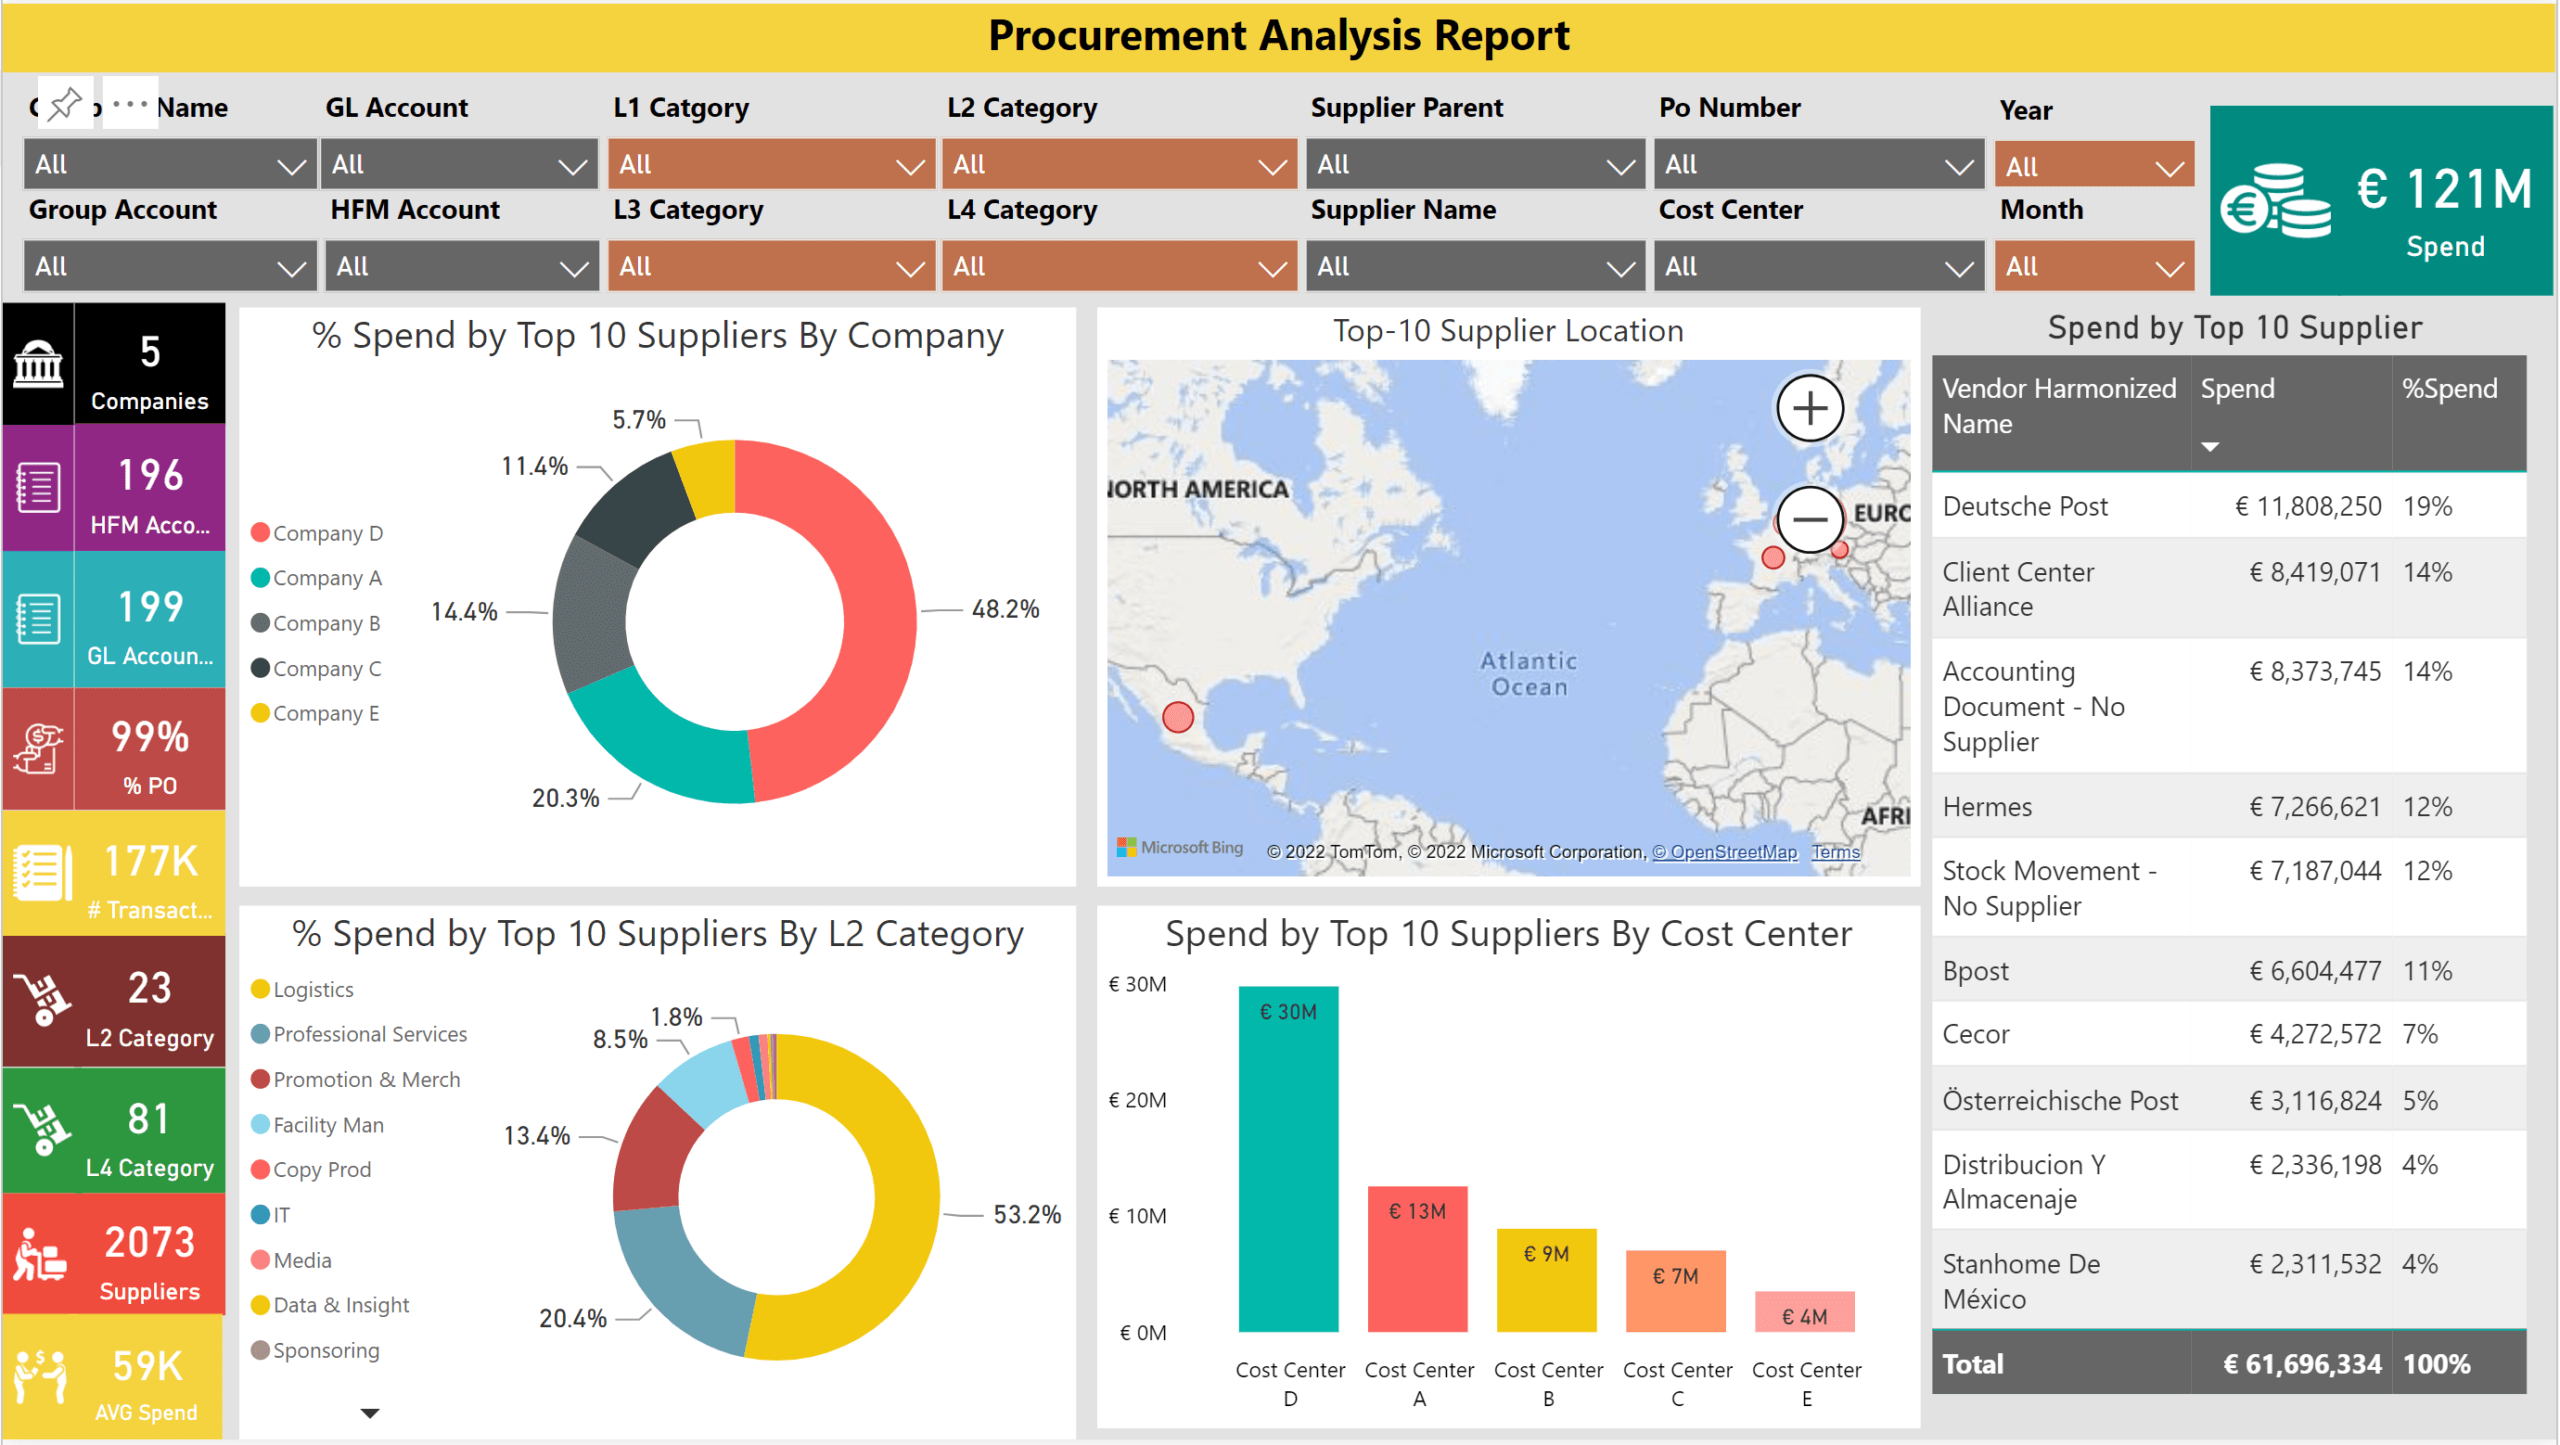
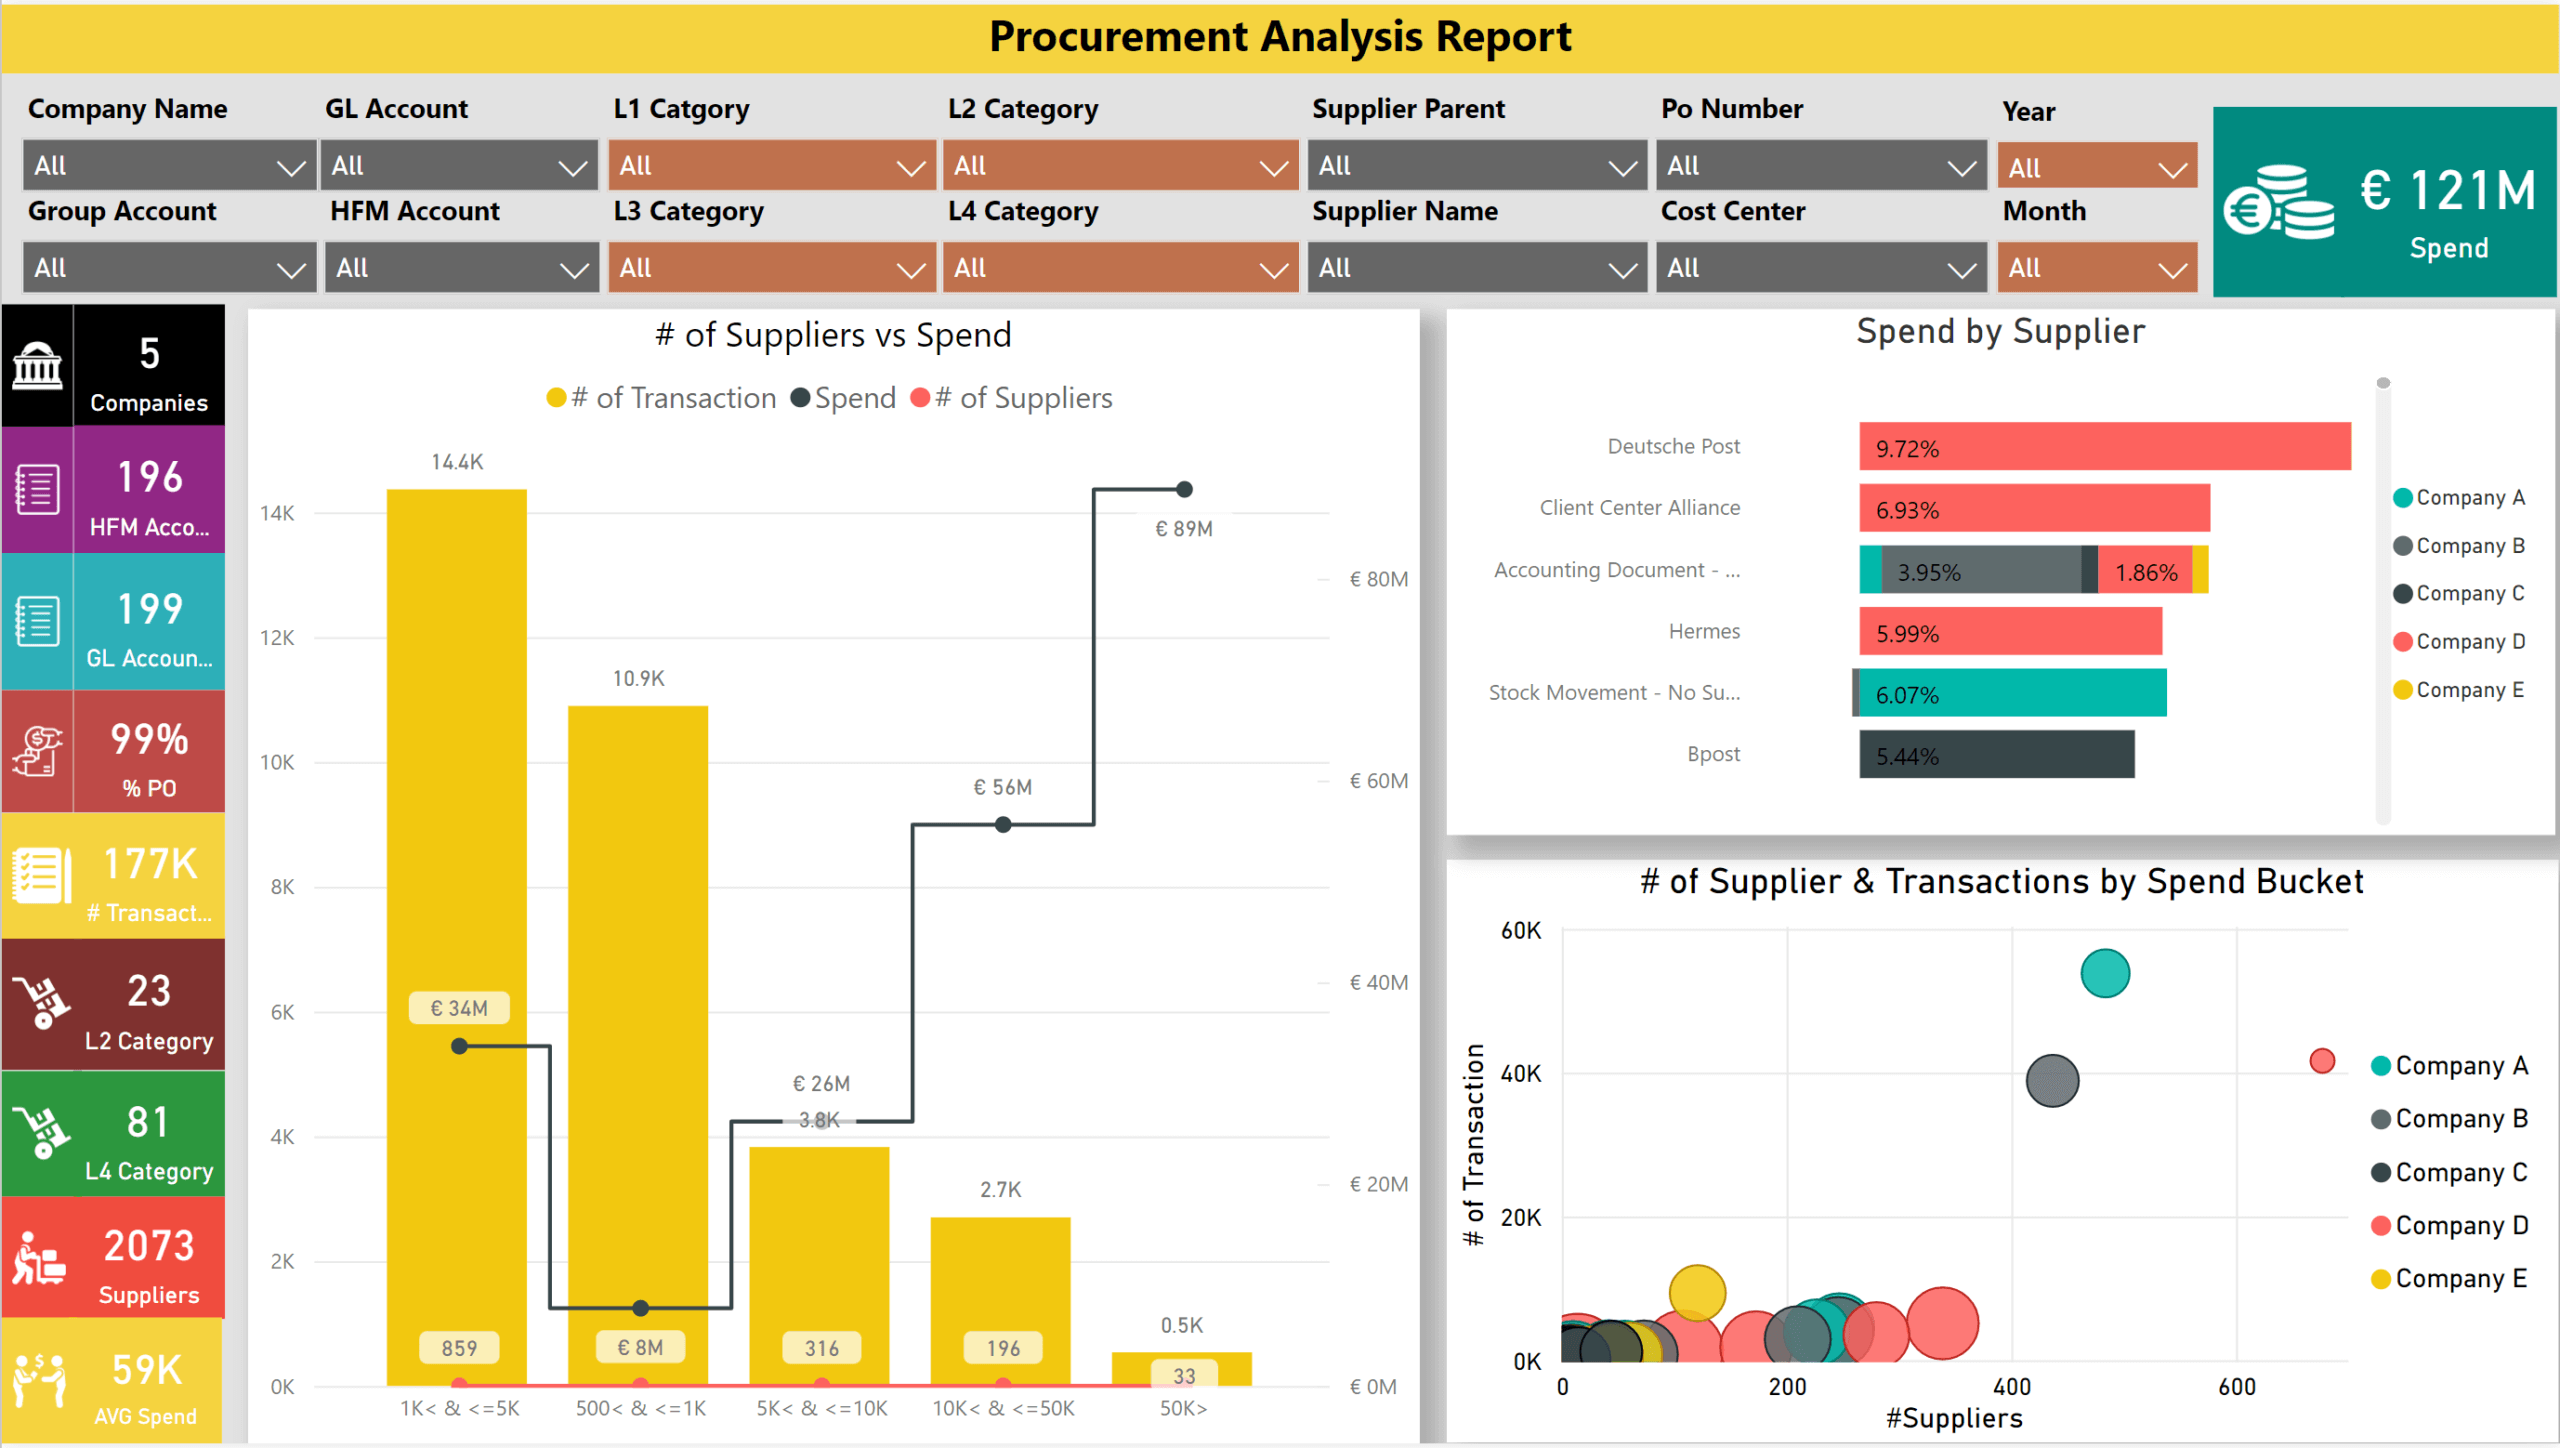
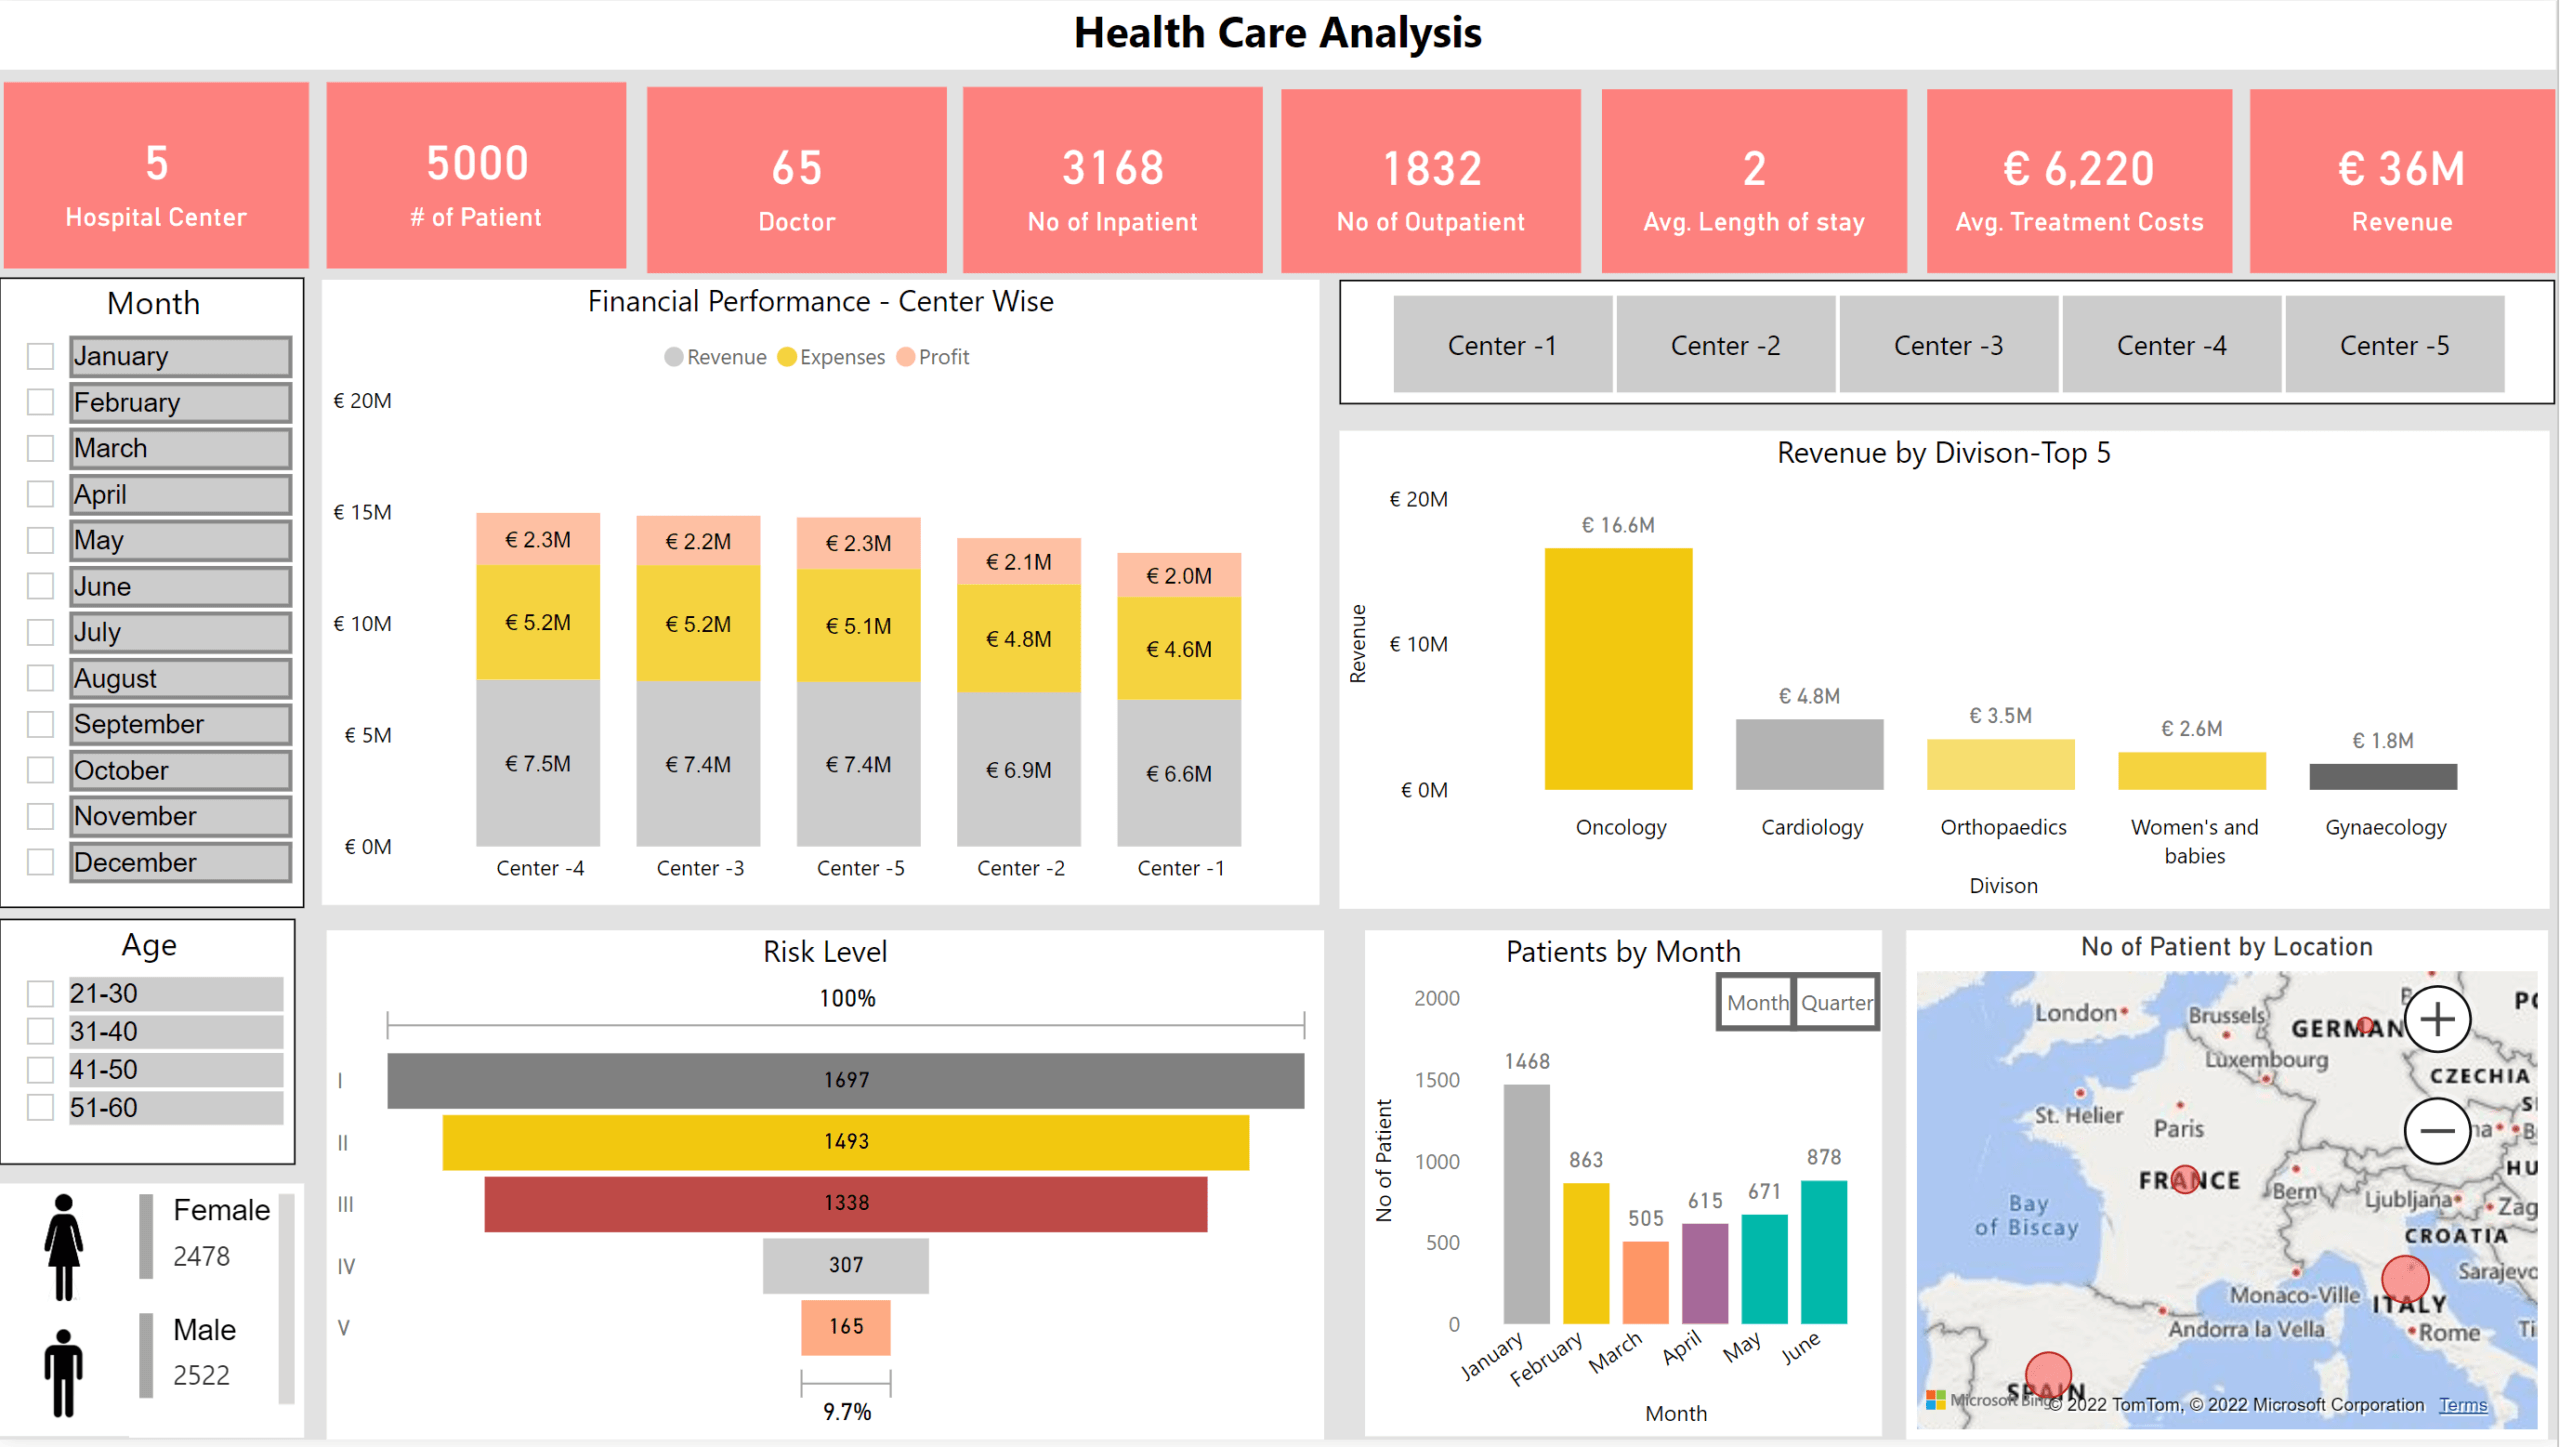
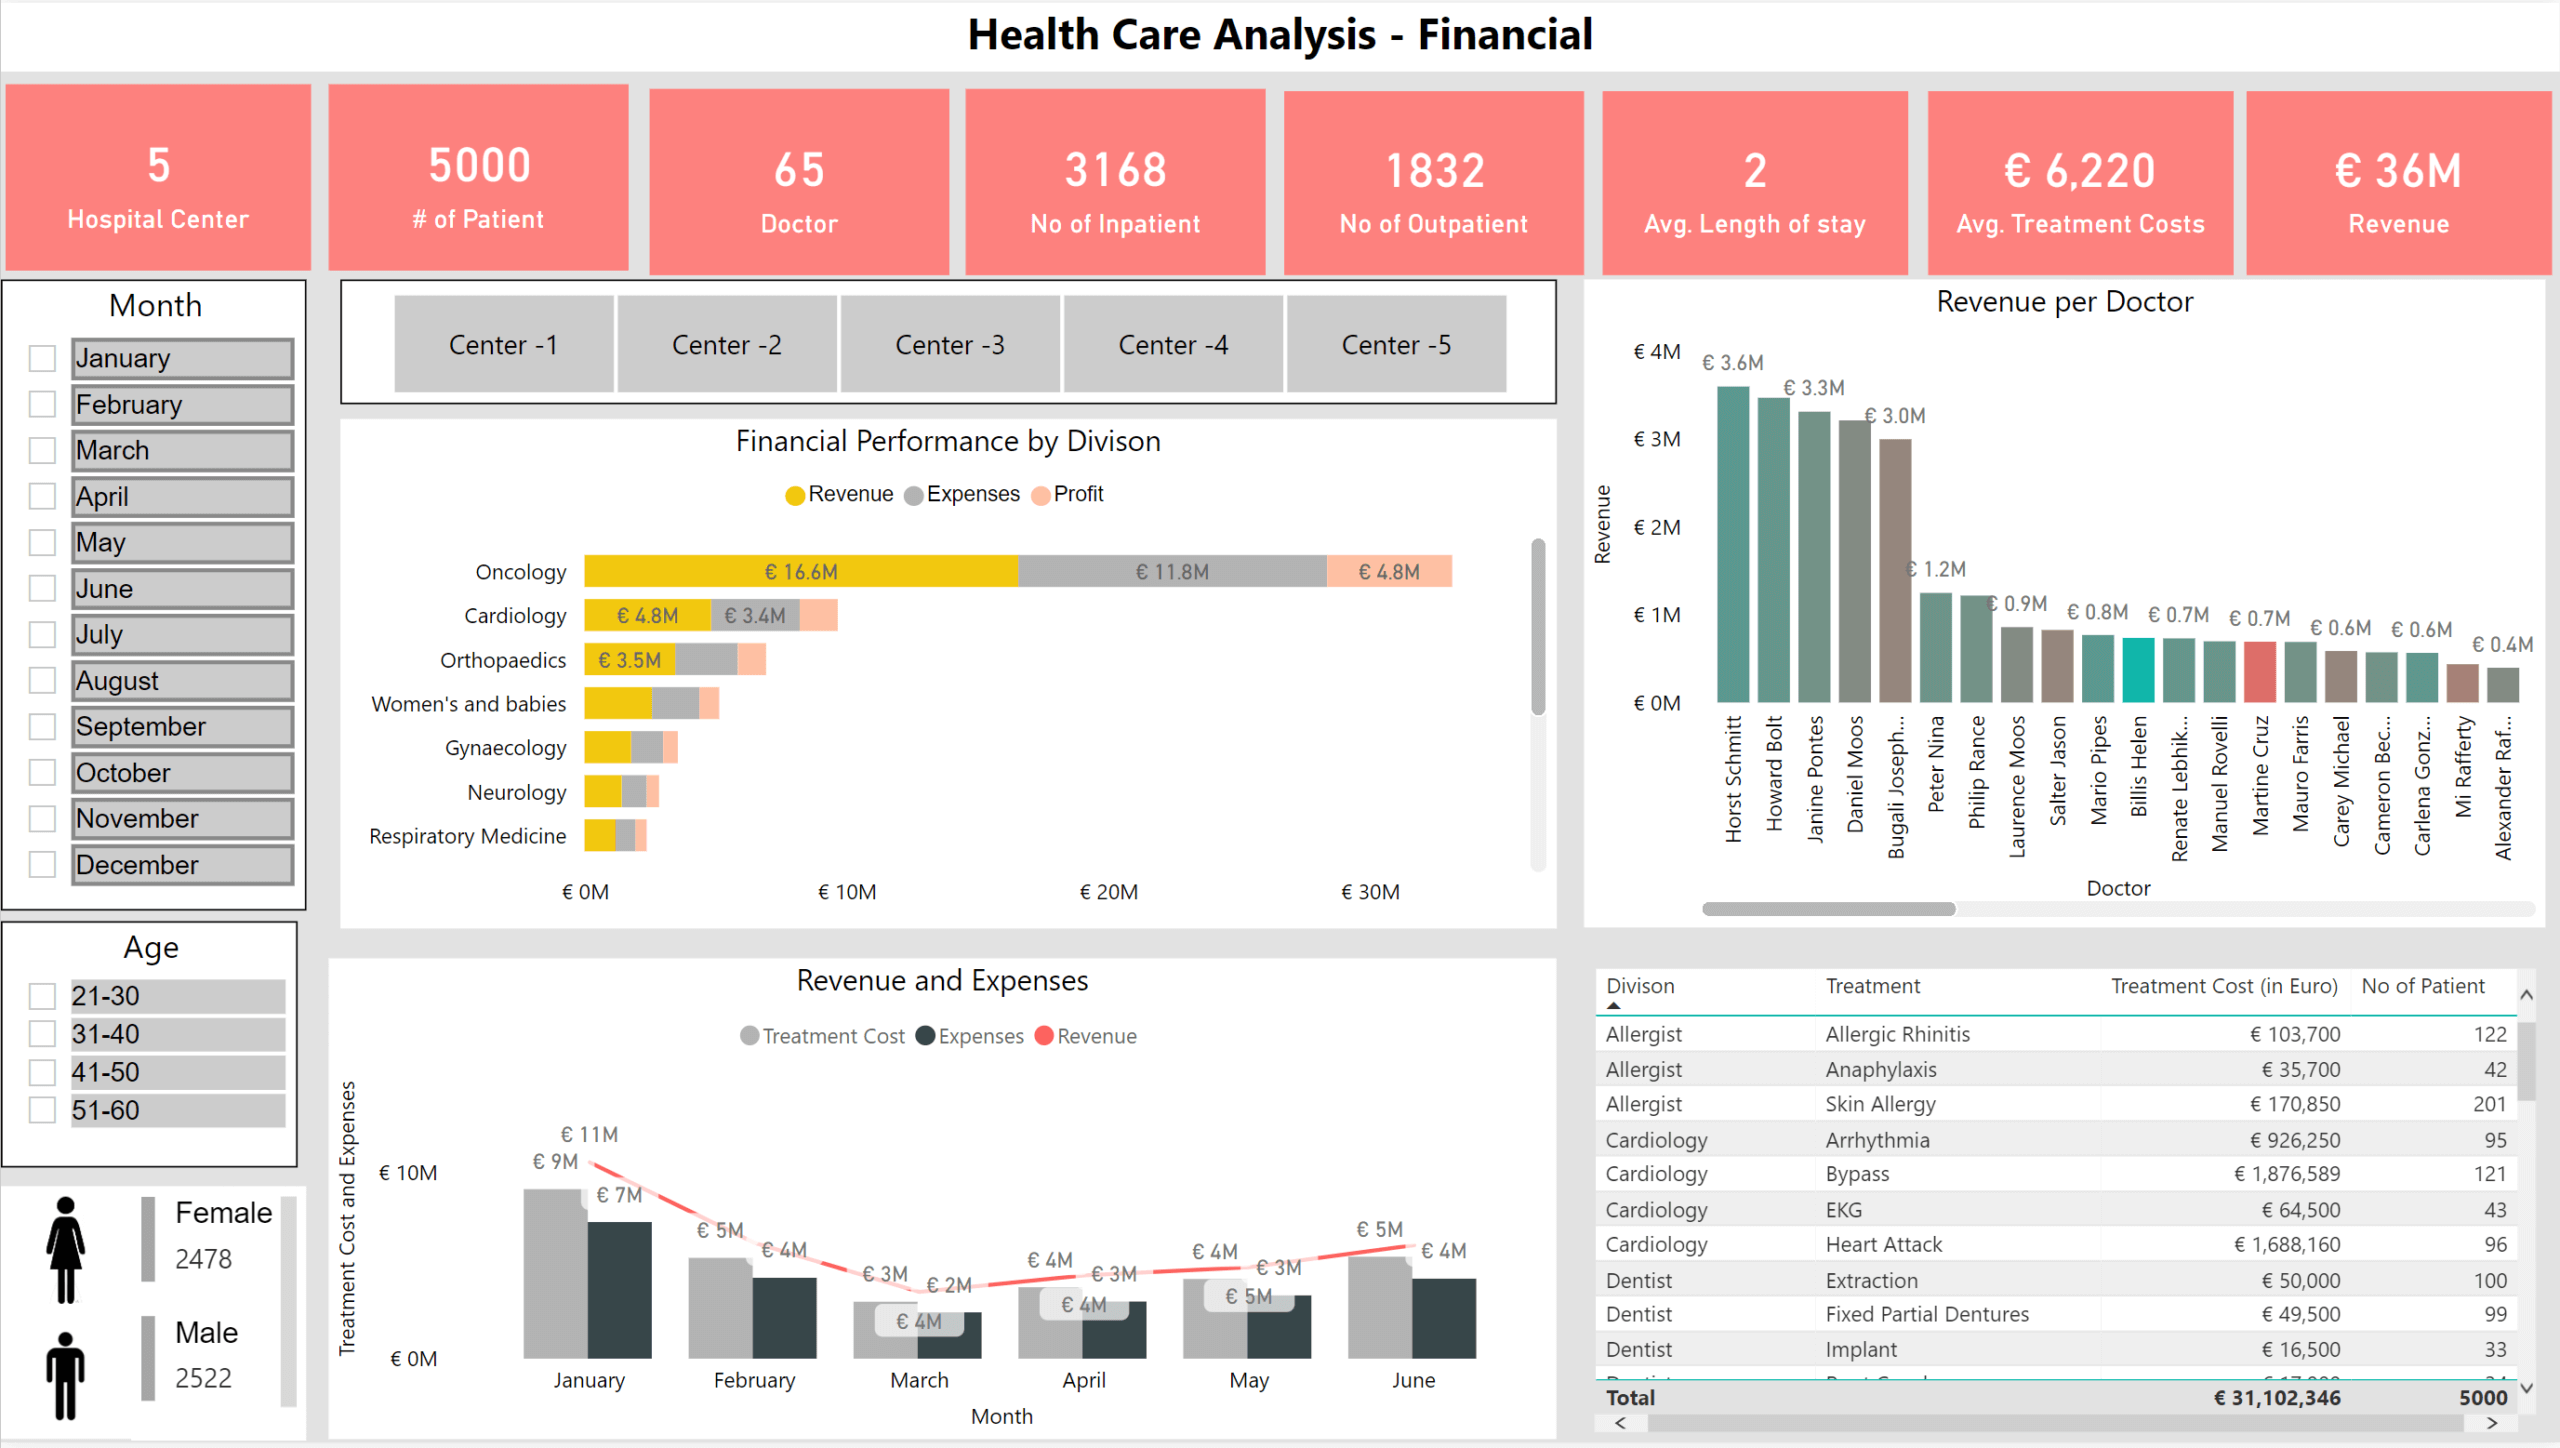
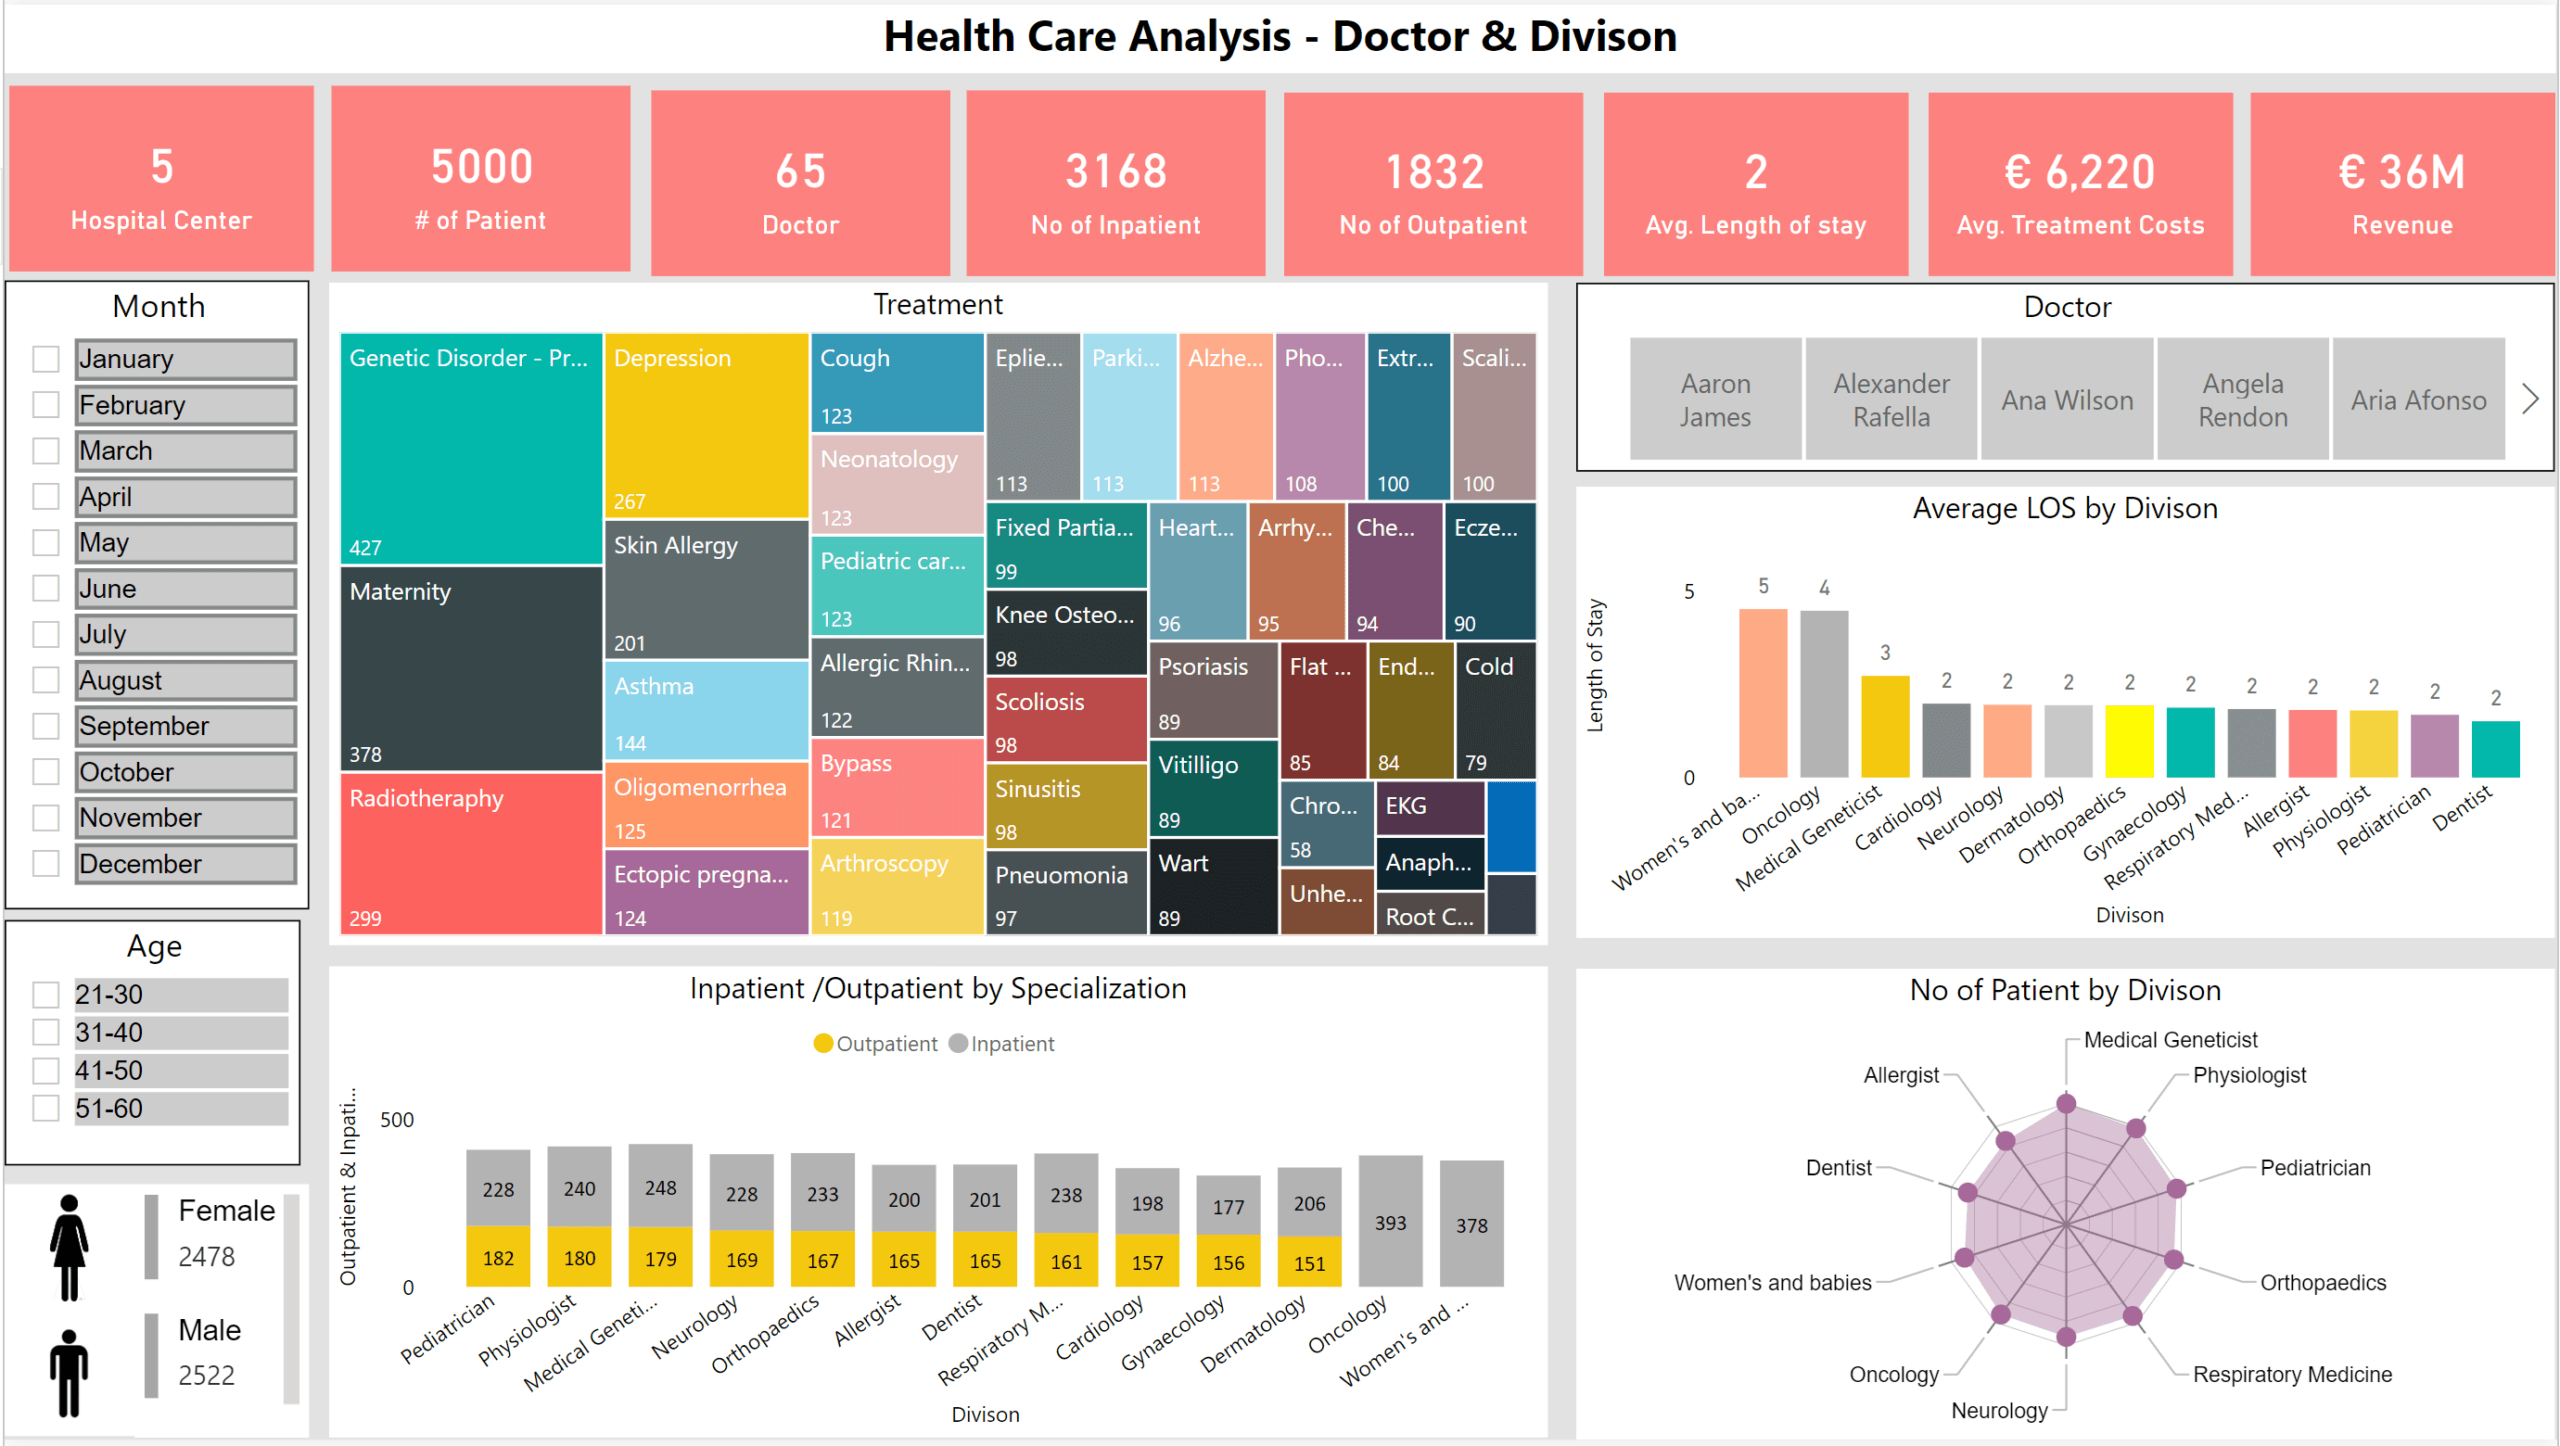
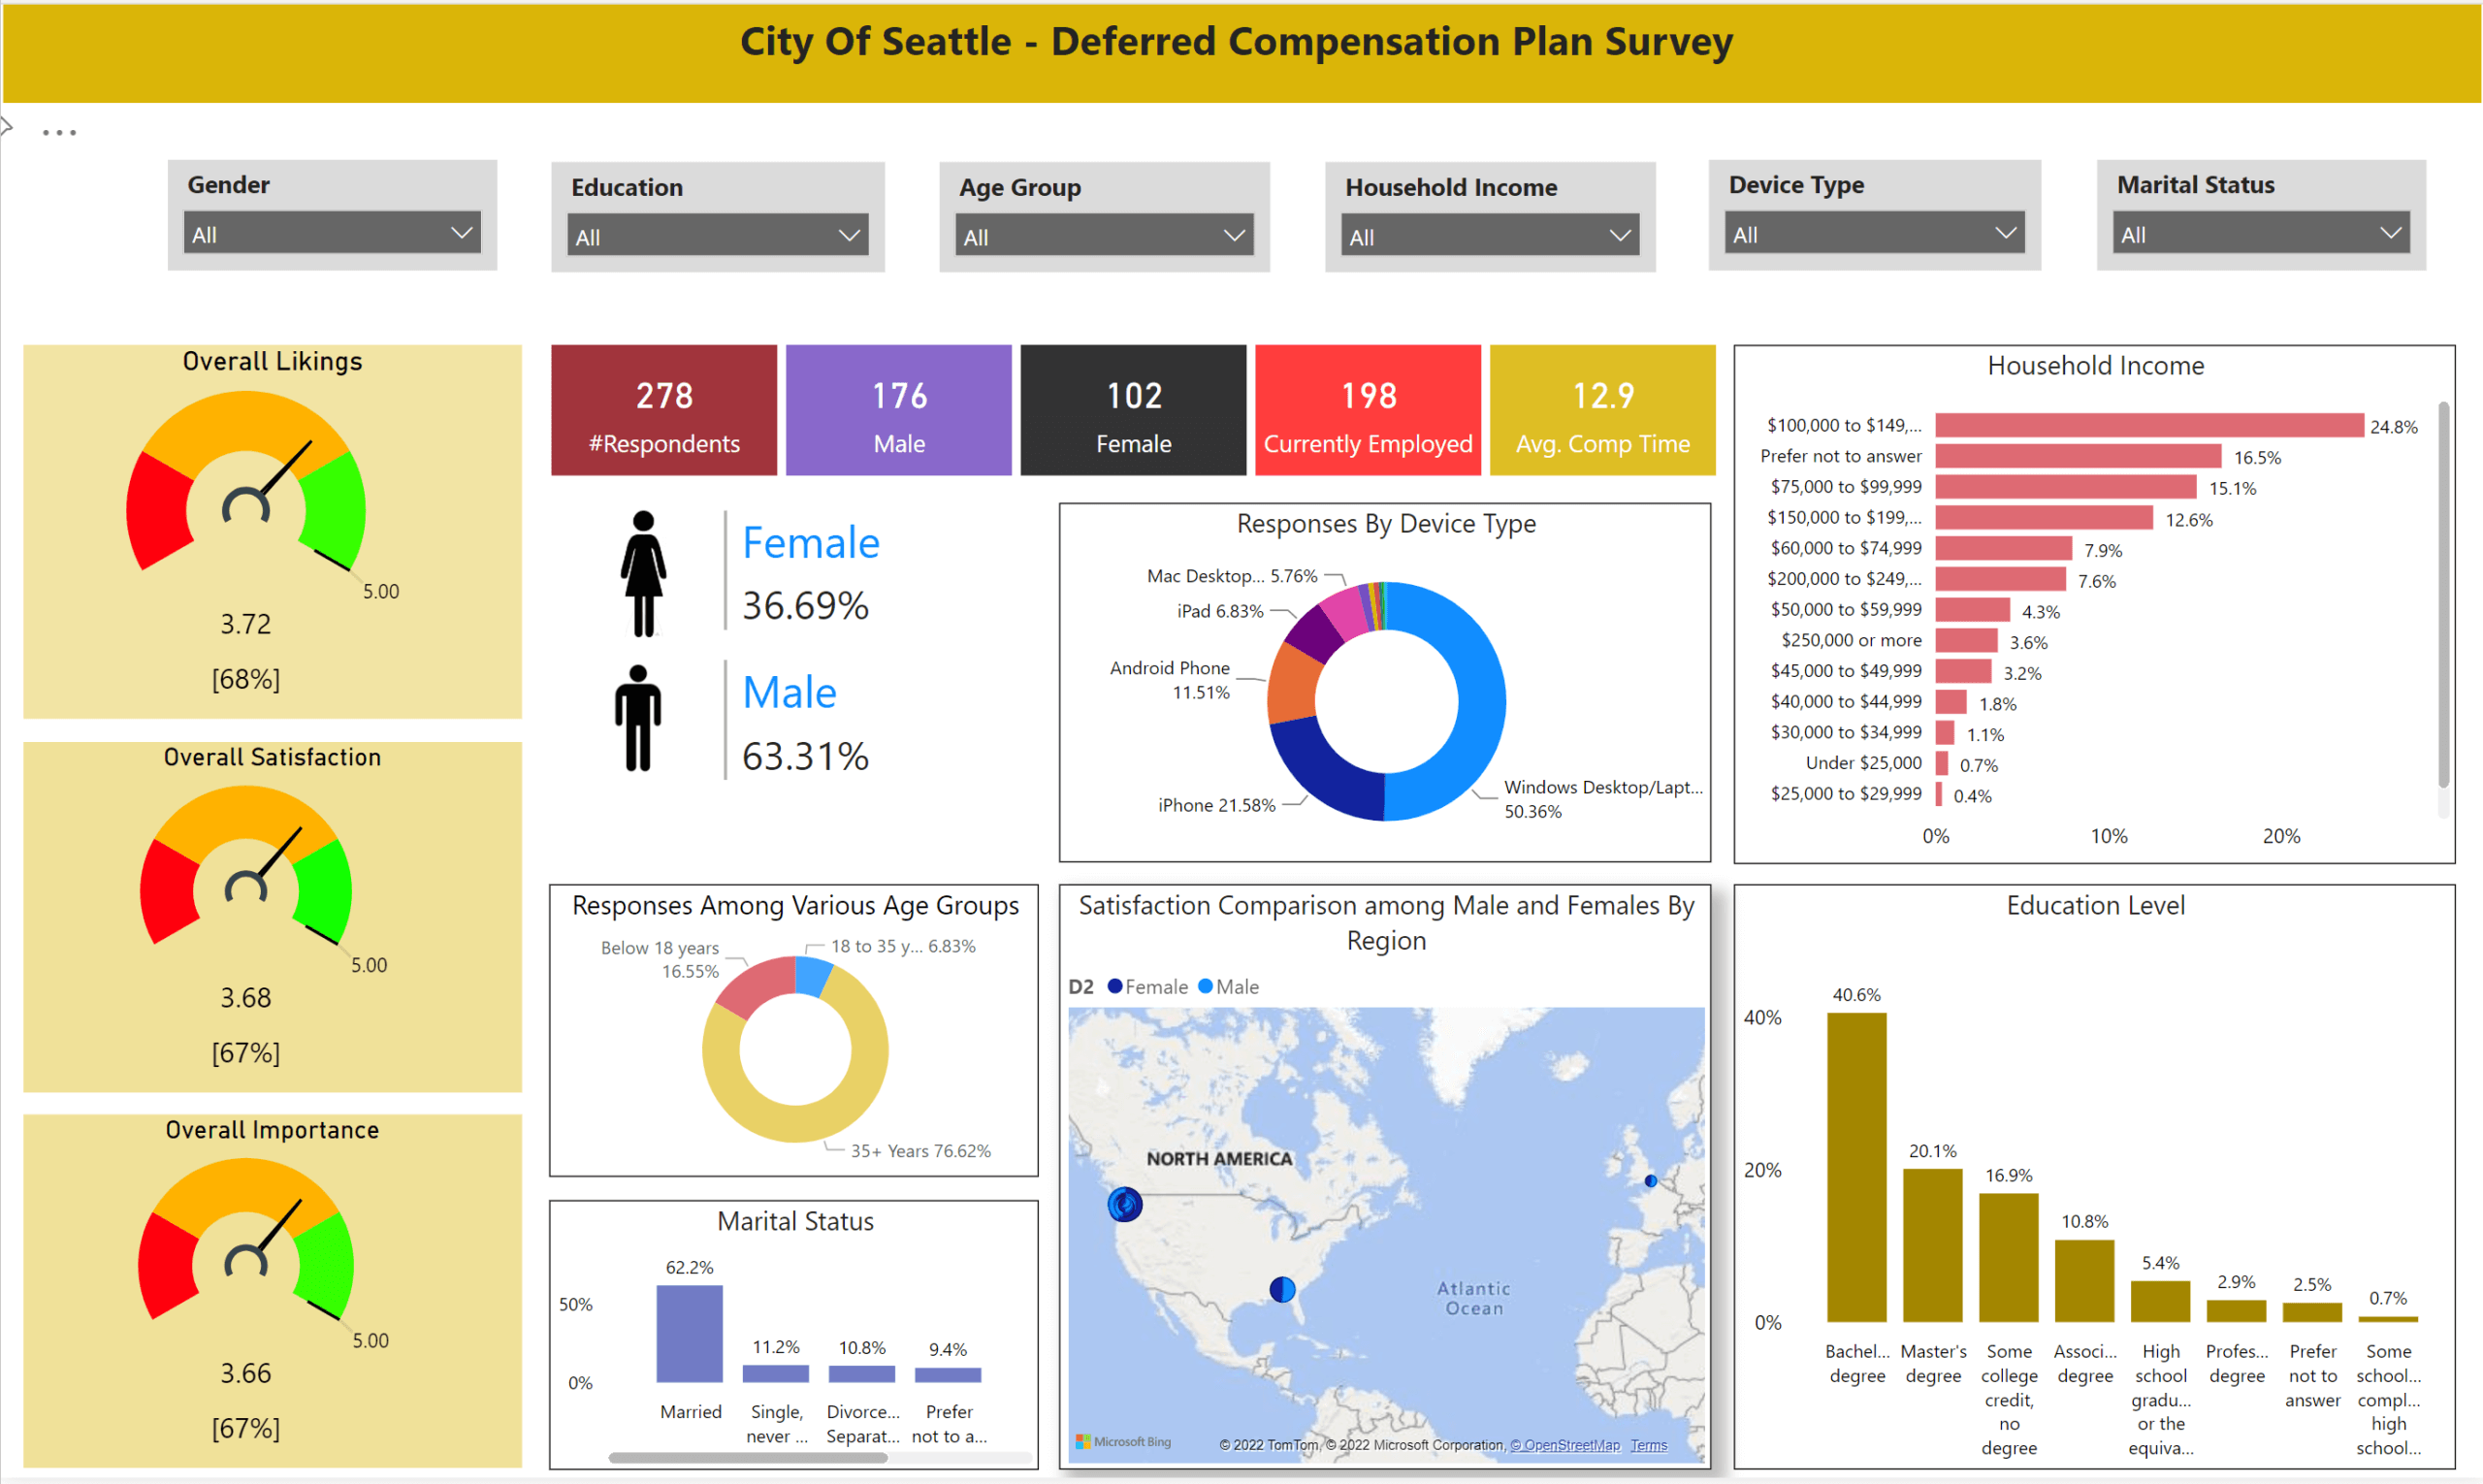
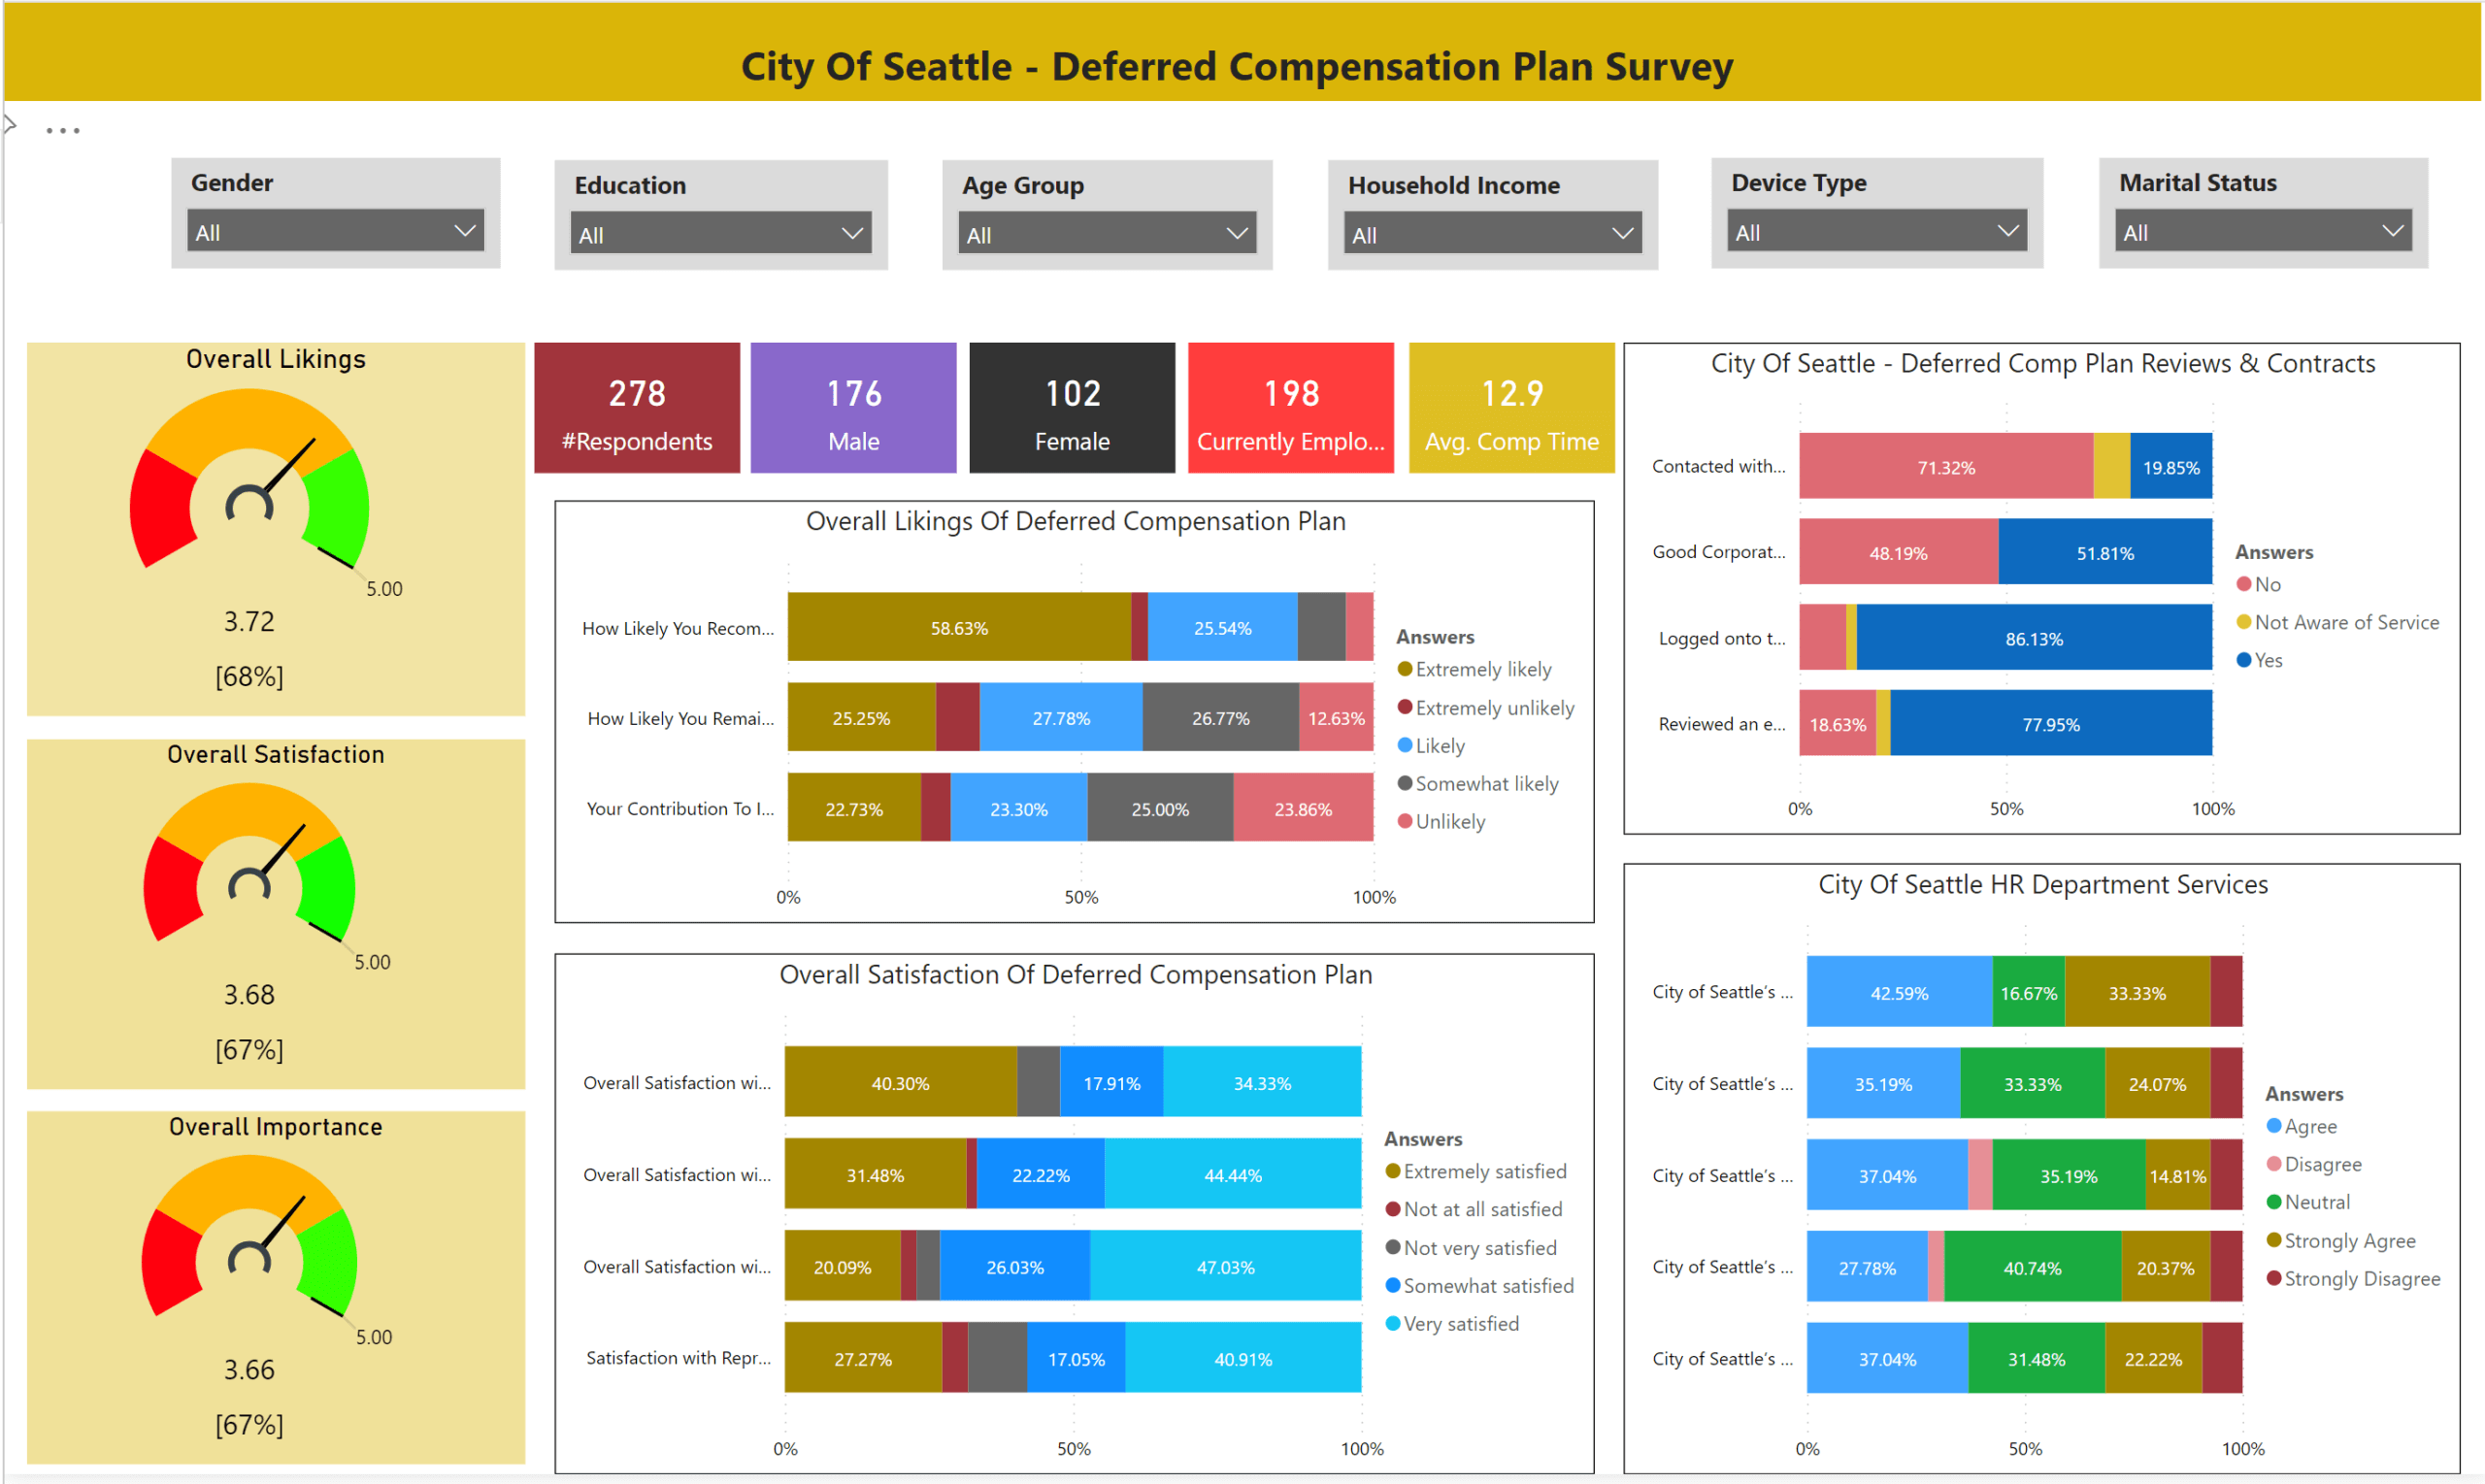
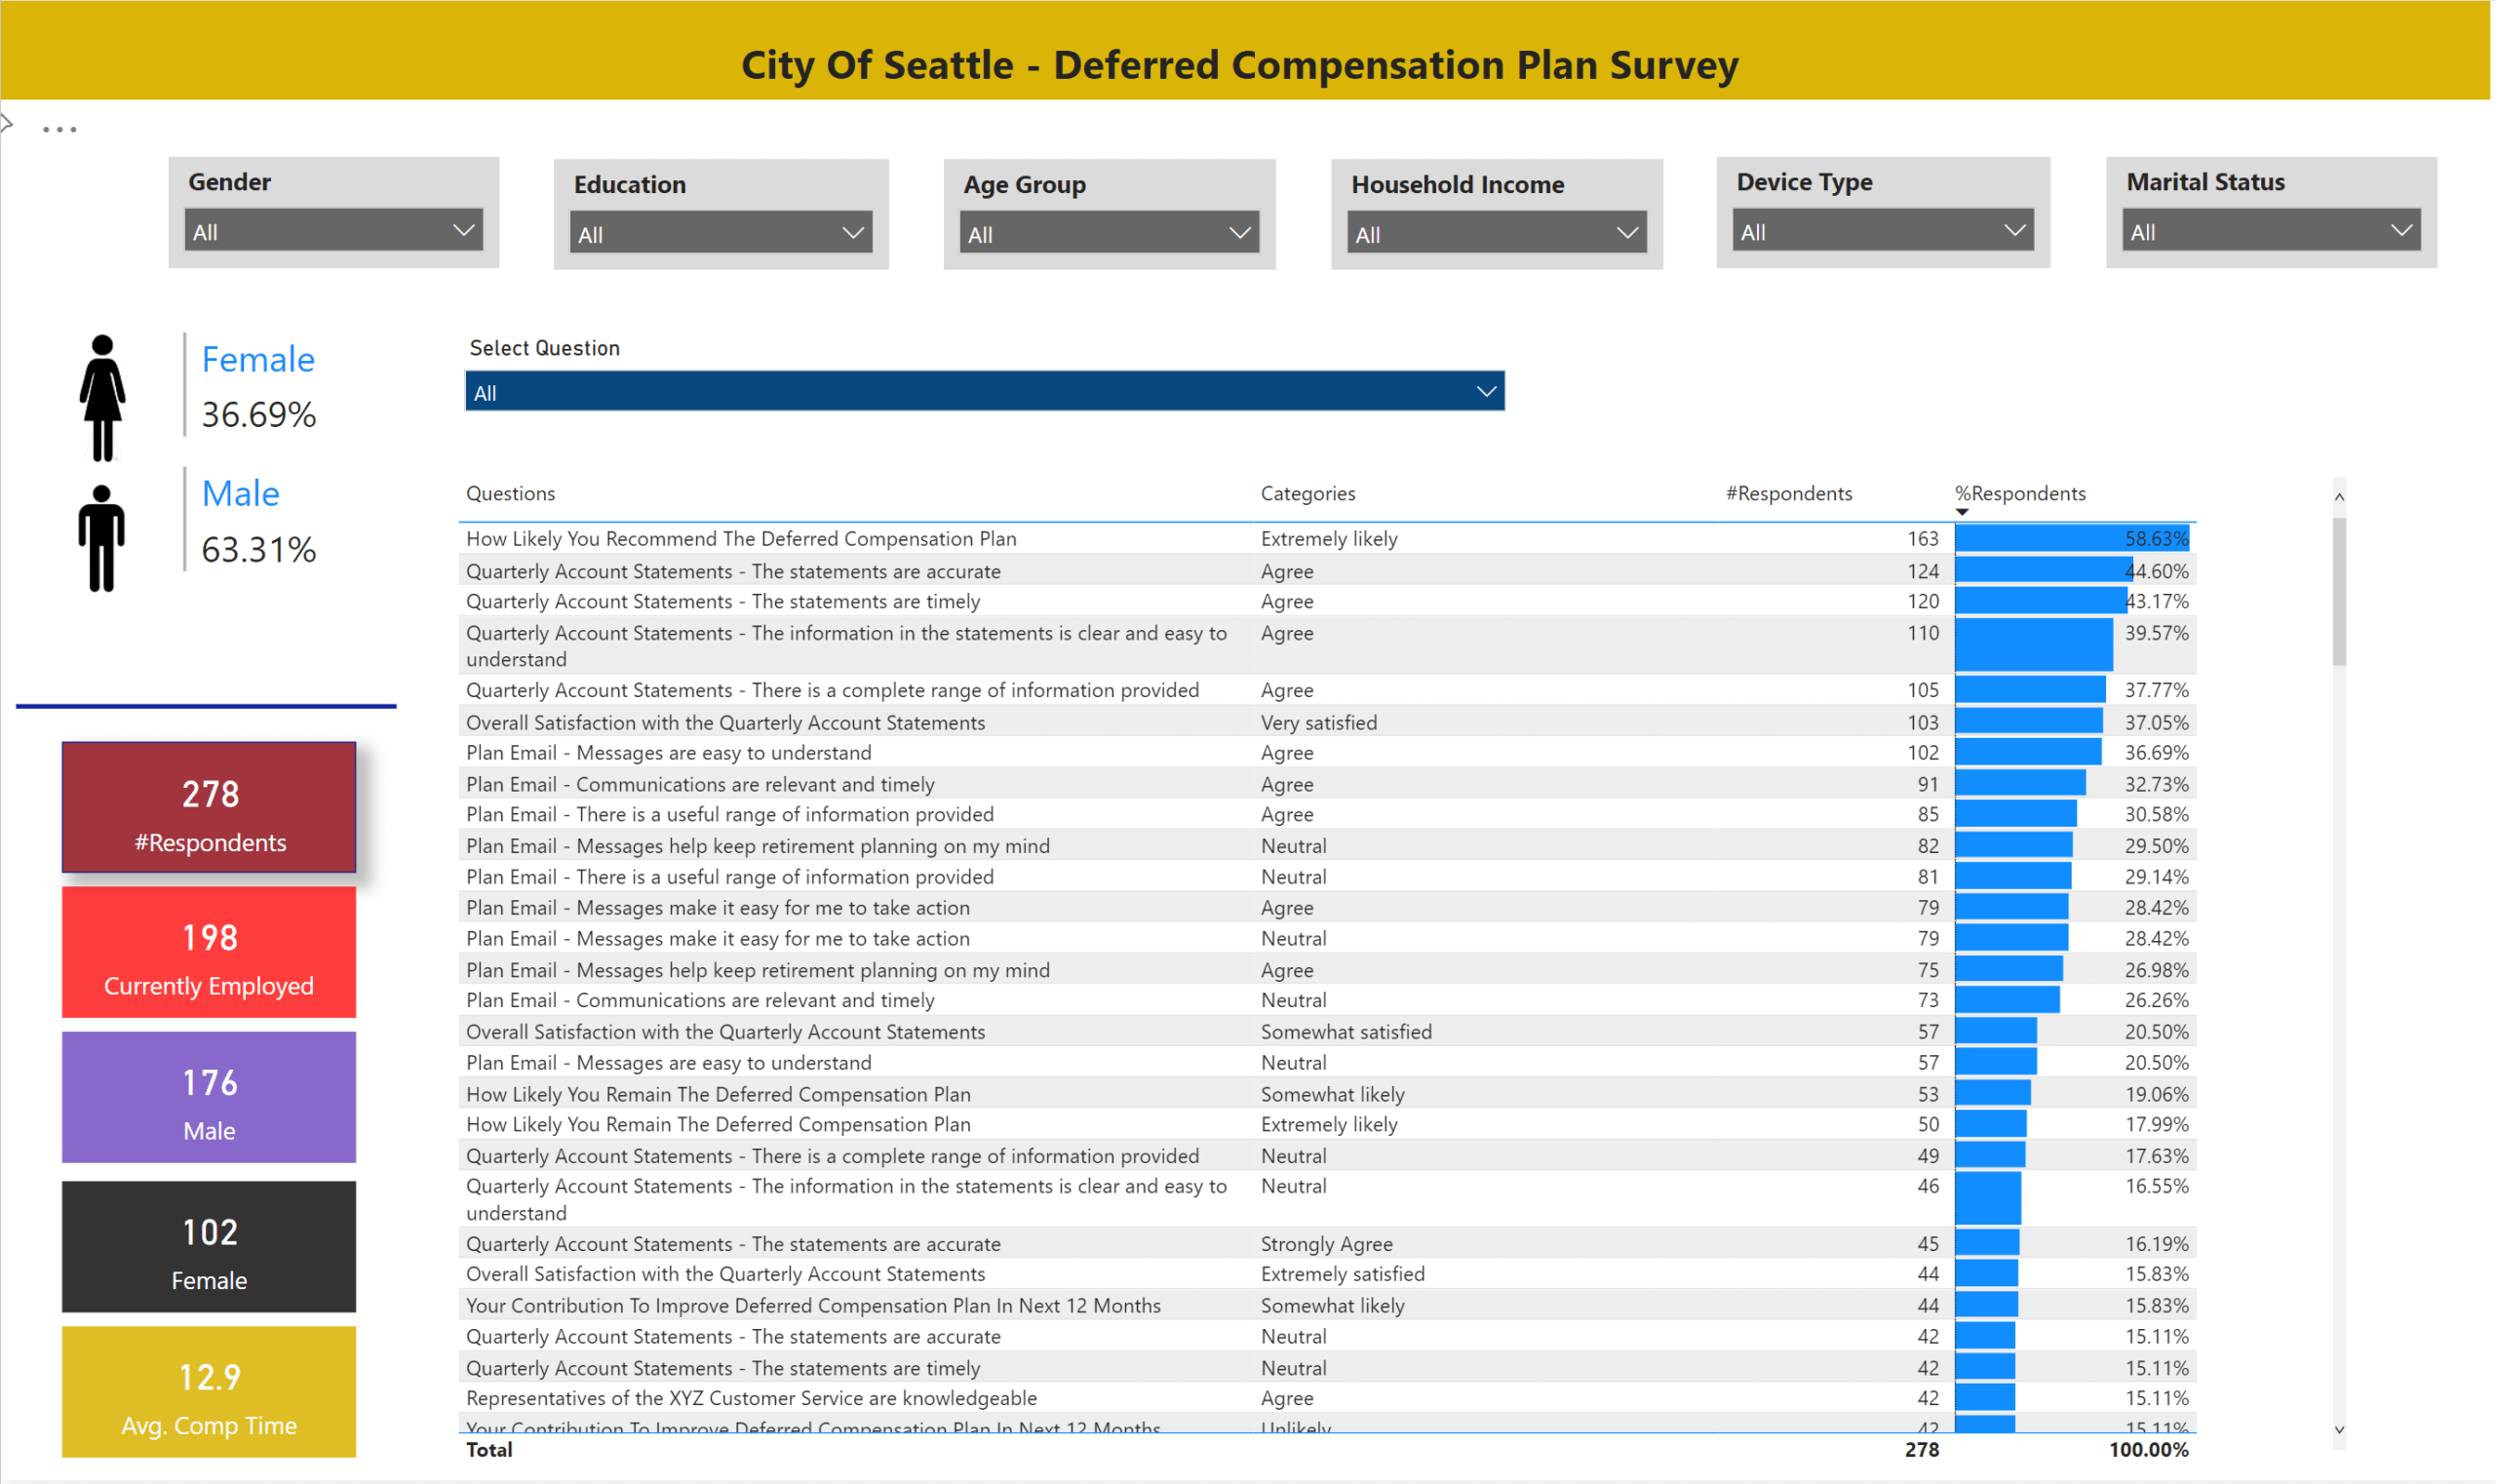
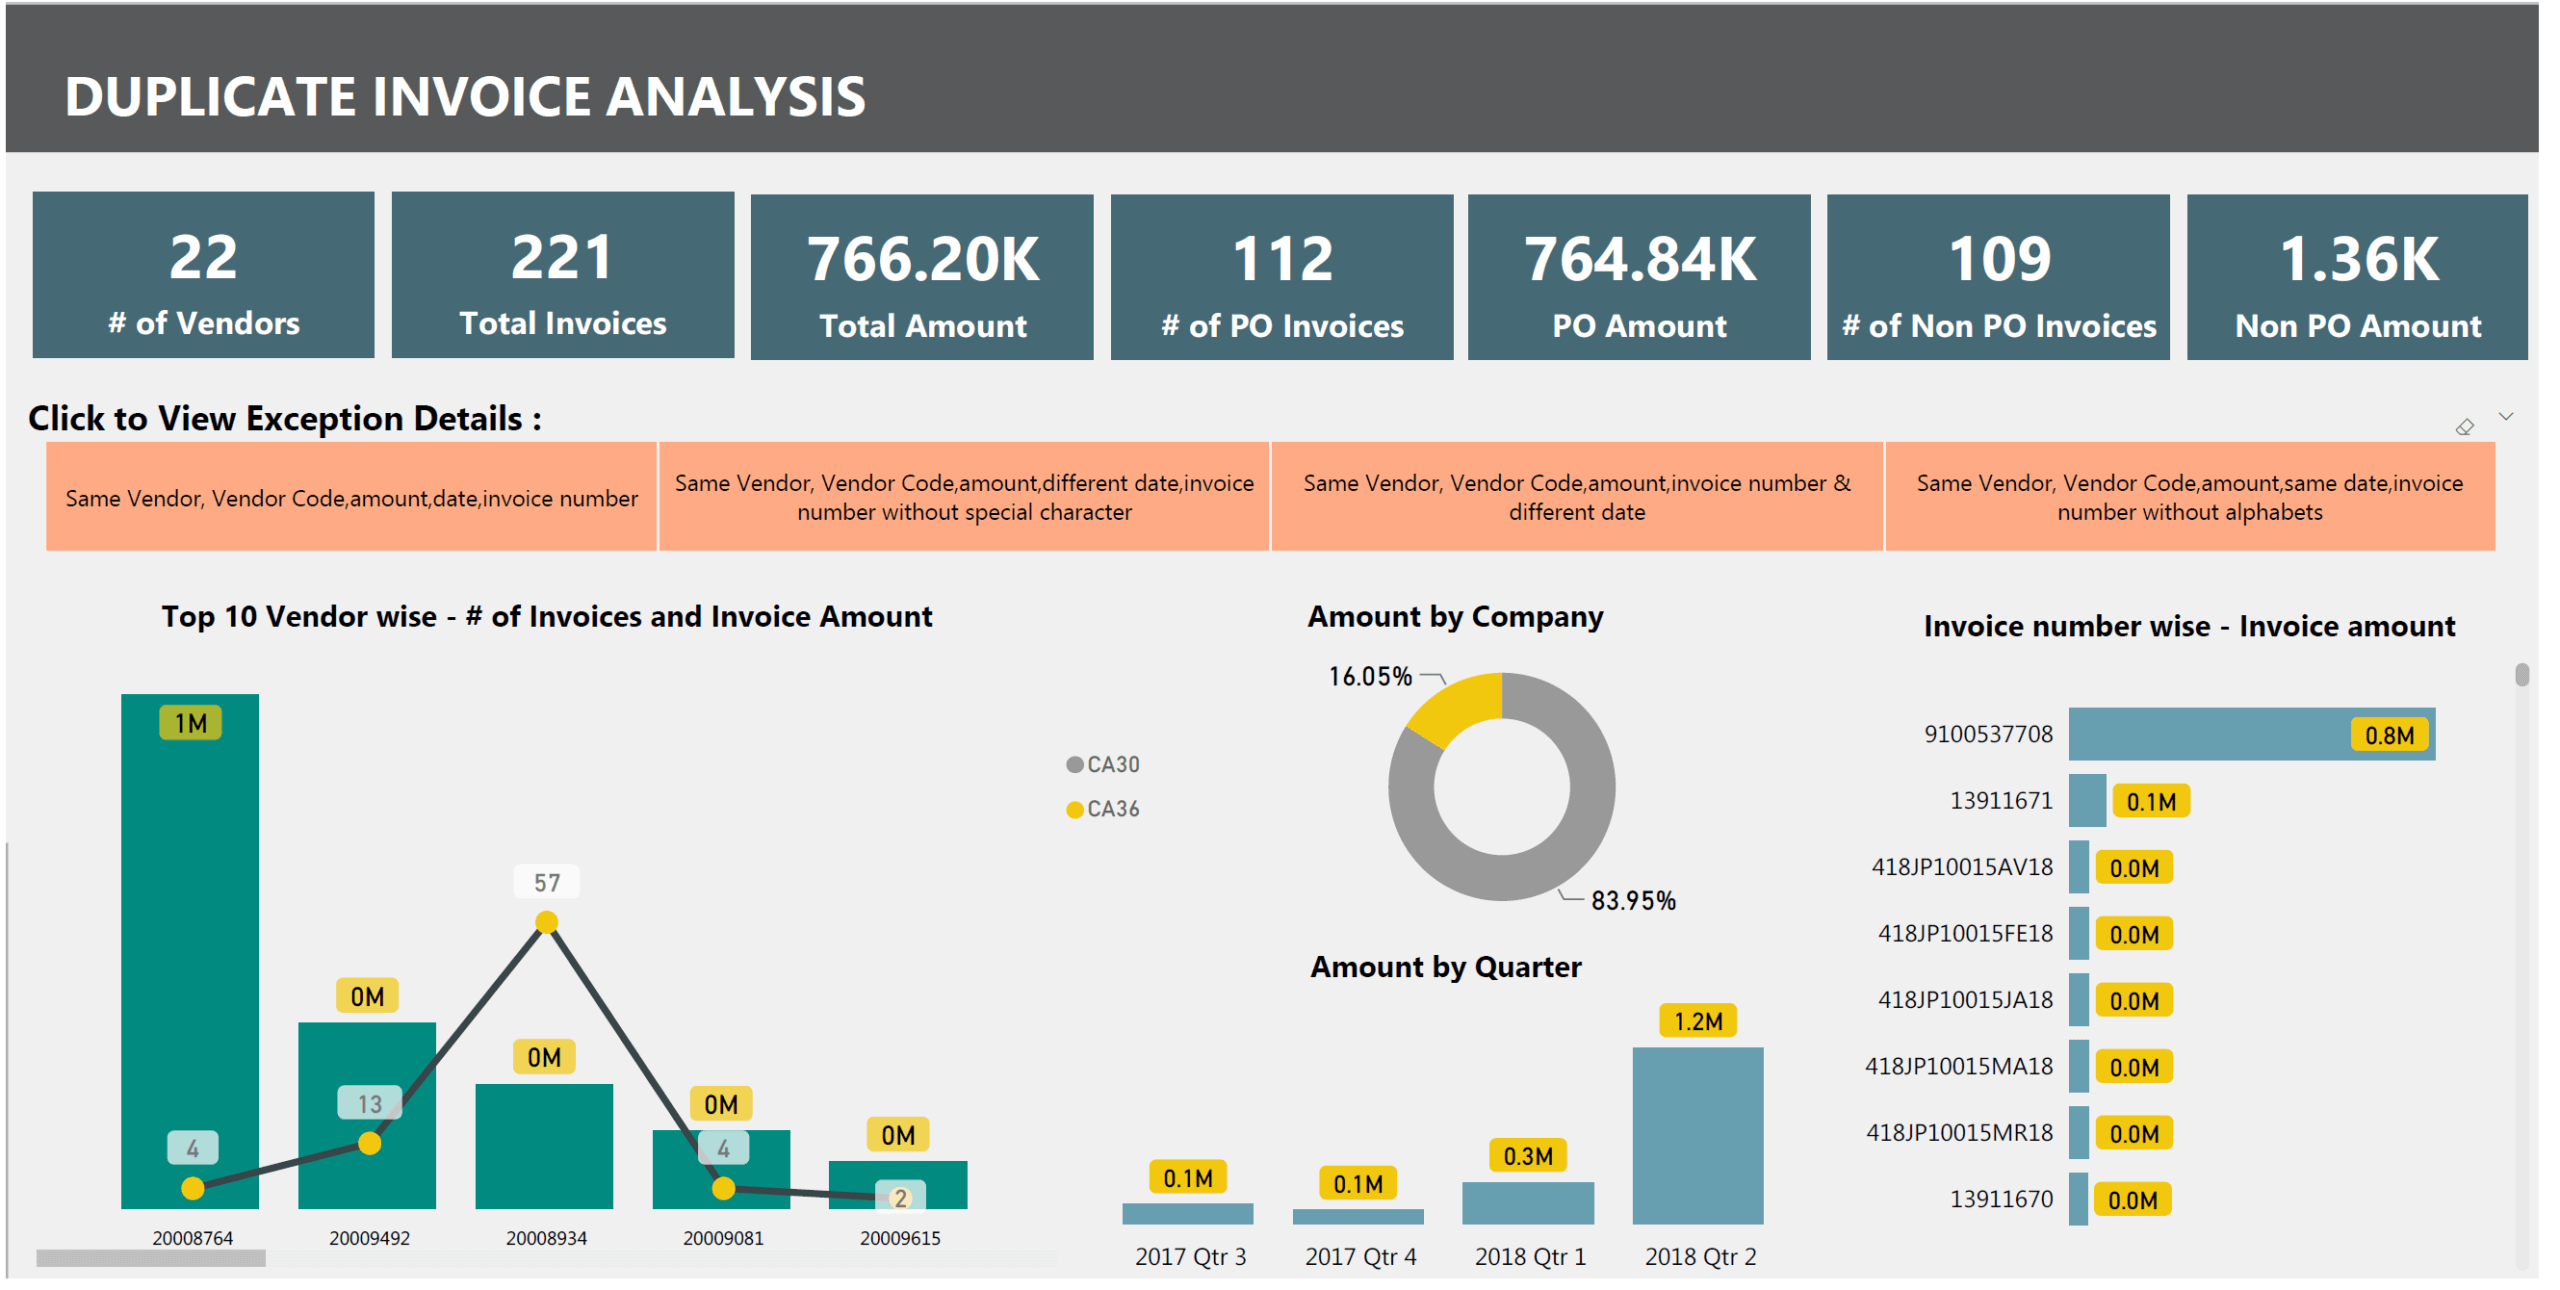
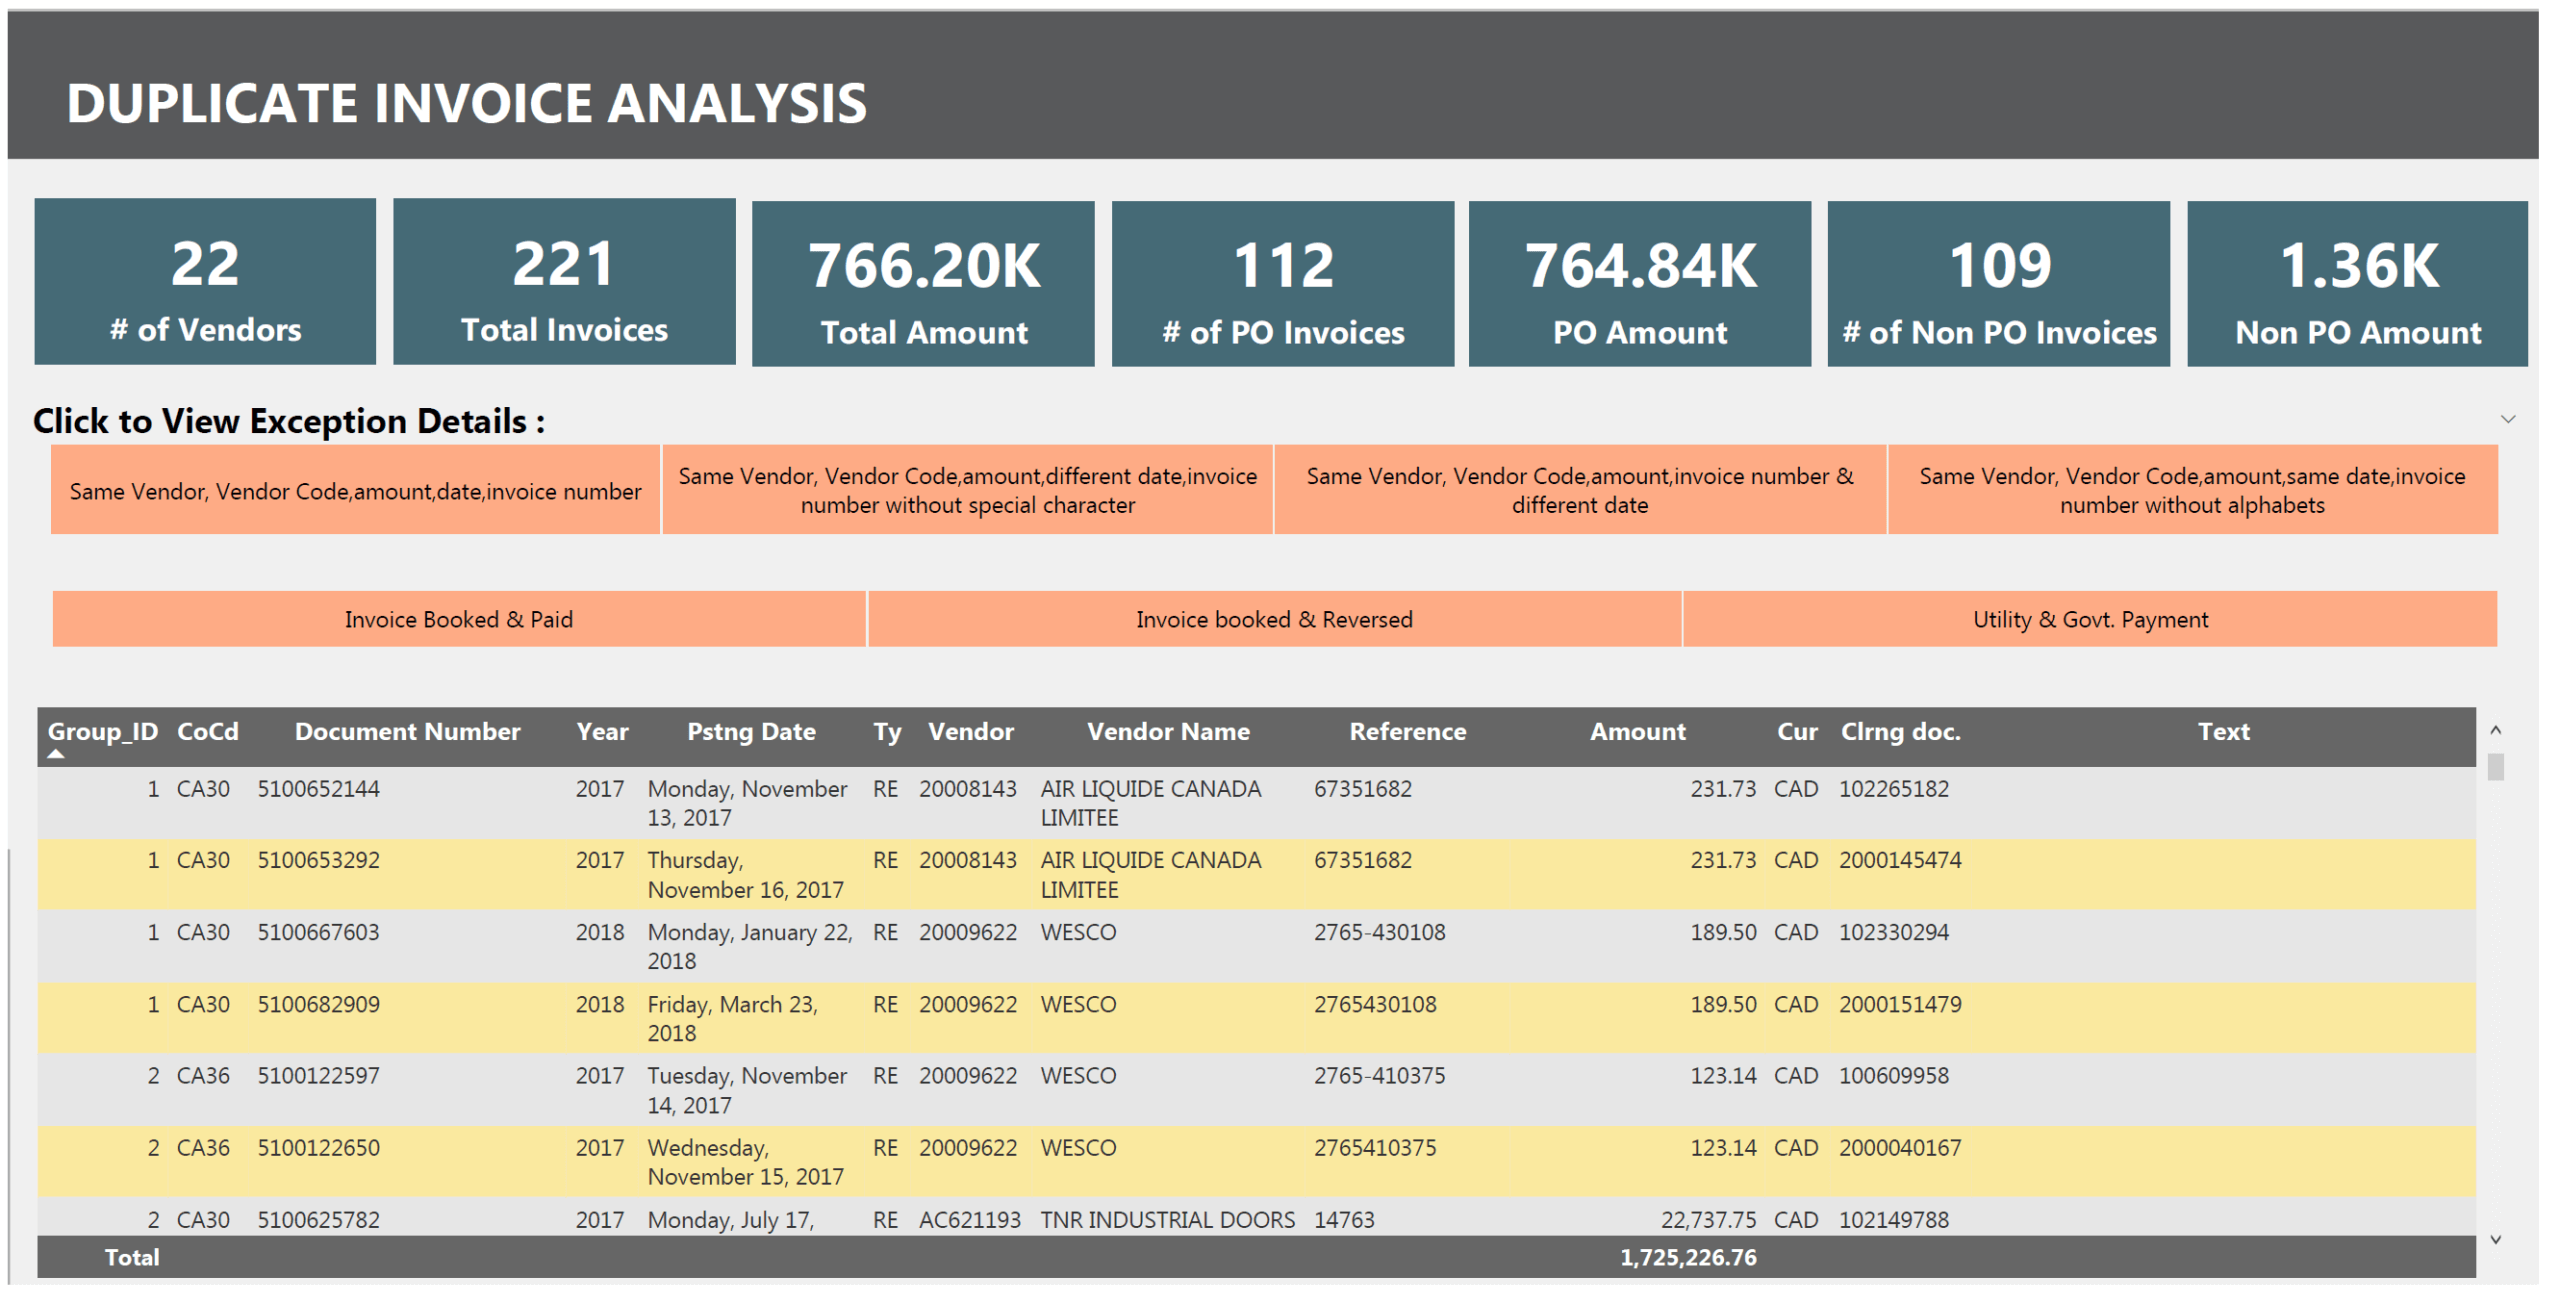
Sample Dashboards & Scorecards

STATXO uses a visualization-driven approach to enable quick deployment of business dashboards with business user-driven and offer strong analytic functions. The key advantages include:
• Empower business users with an intuitive monitoring and analytic environment resulting in enhanced business performance.
• Within an executive dashboard, statistics and data for the company can be closely monitored by the senior management.
• Within dashboards, scorecards are designed using a well-defined method for monitoring, measuring, and managing performance by tracking metrics.

  • Promotional Analysis
  • Spend Analysis
  • Accounts Payable Analysis
  • Supplier Risk Assessment
  • Healthcare Data Analysis
  • Survey Data Analysis
  • Duplicate Invoice Analysis
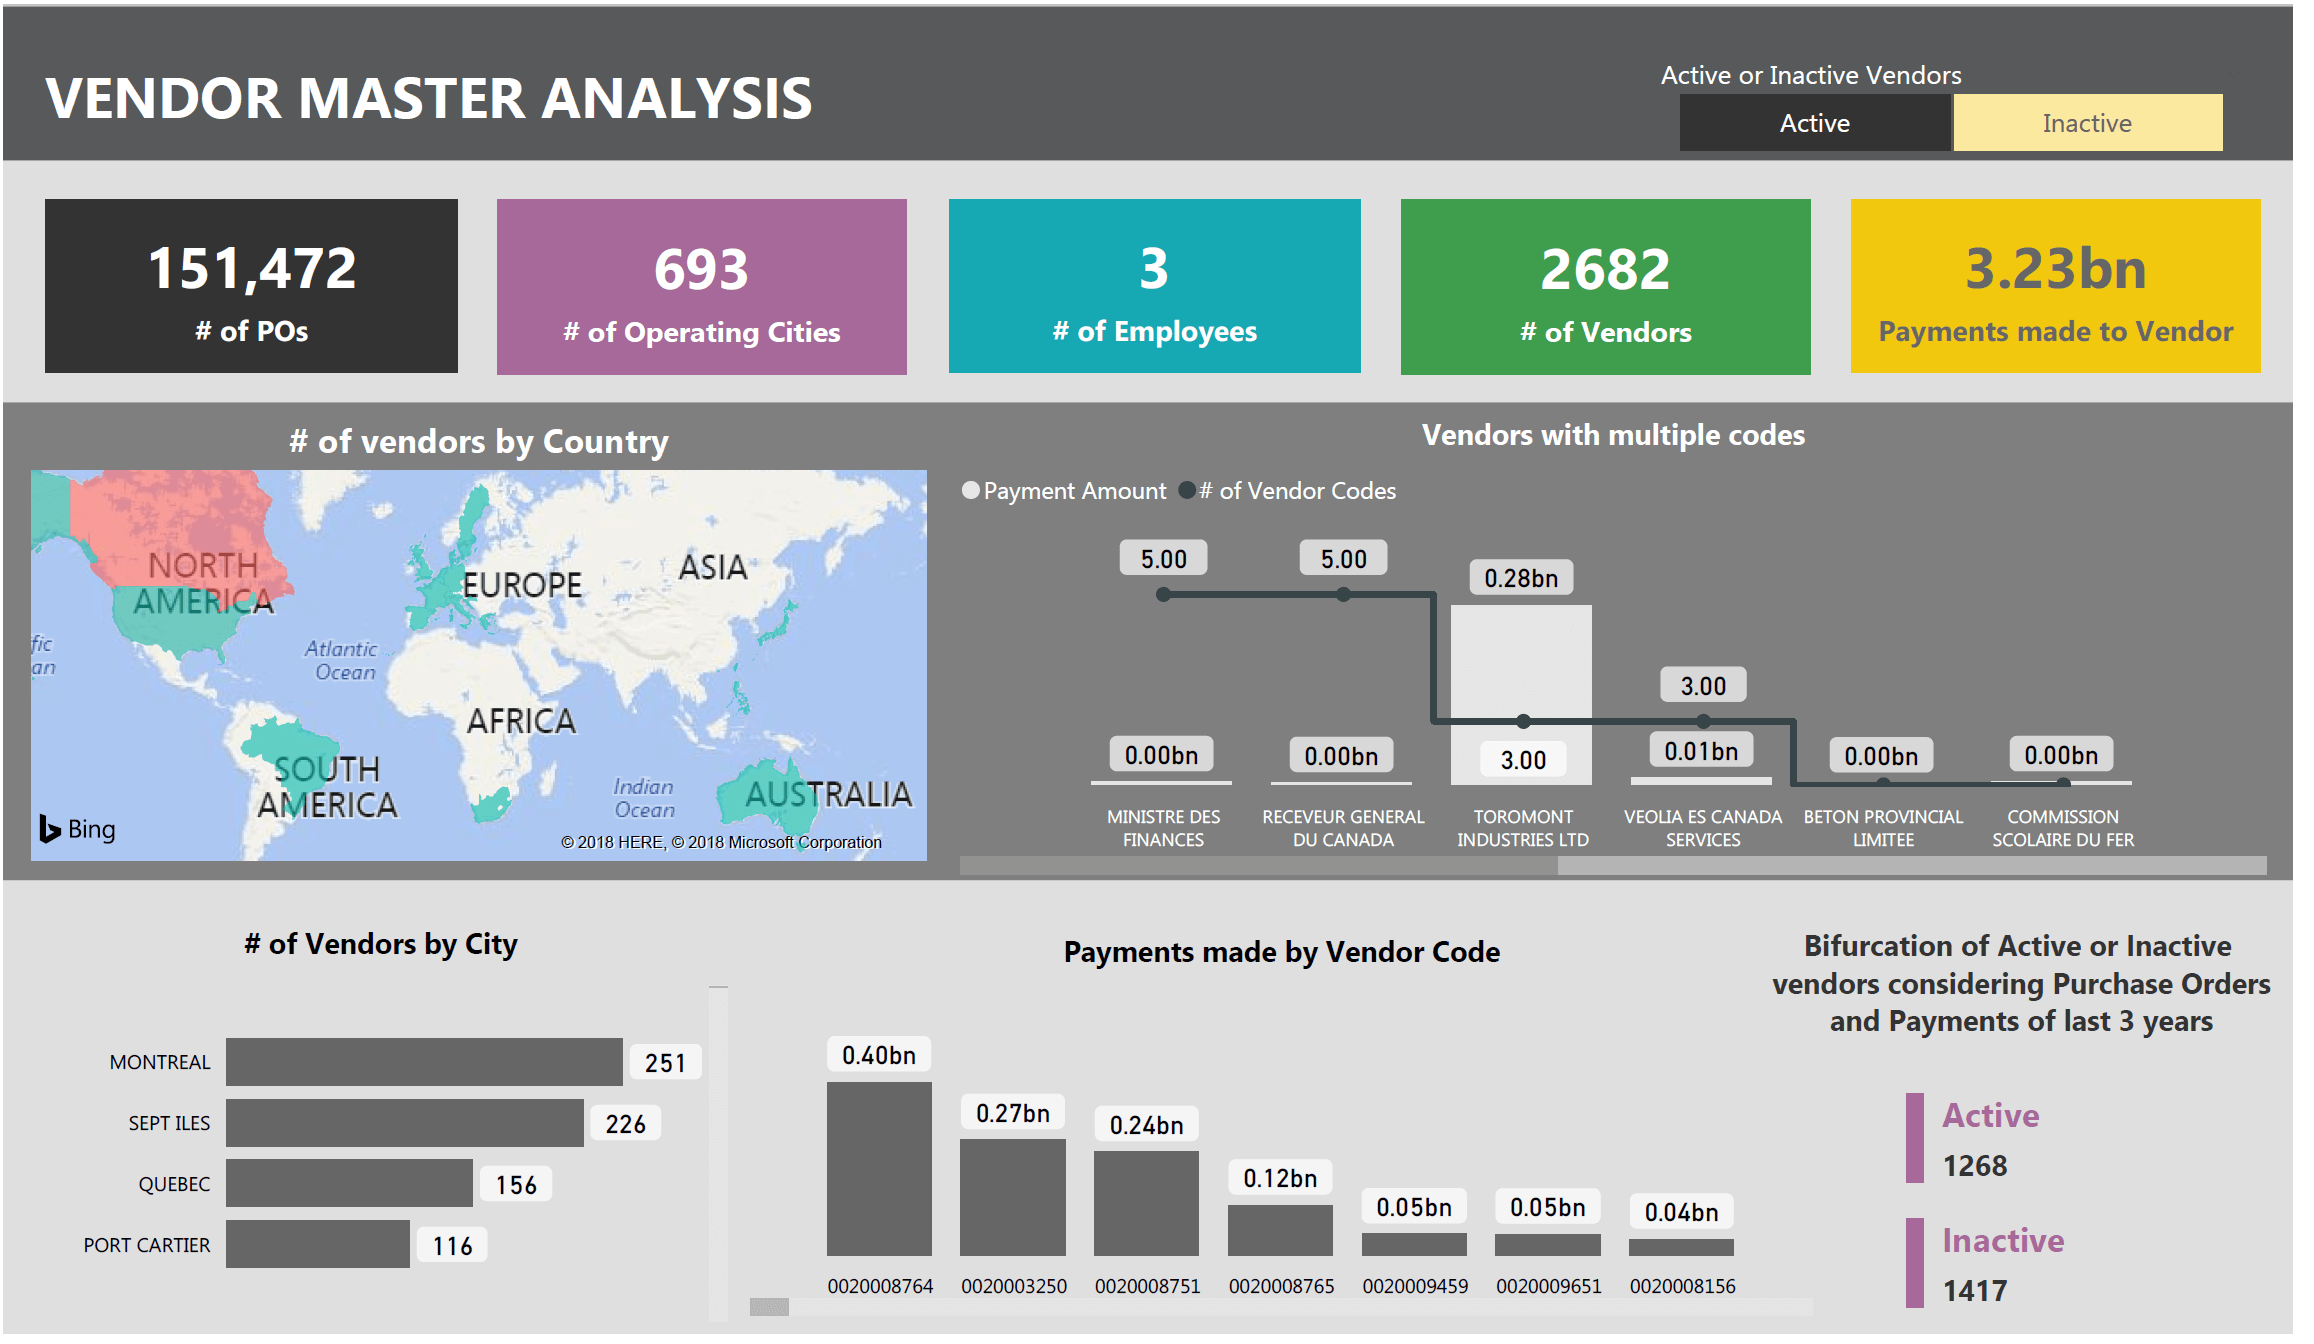
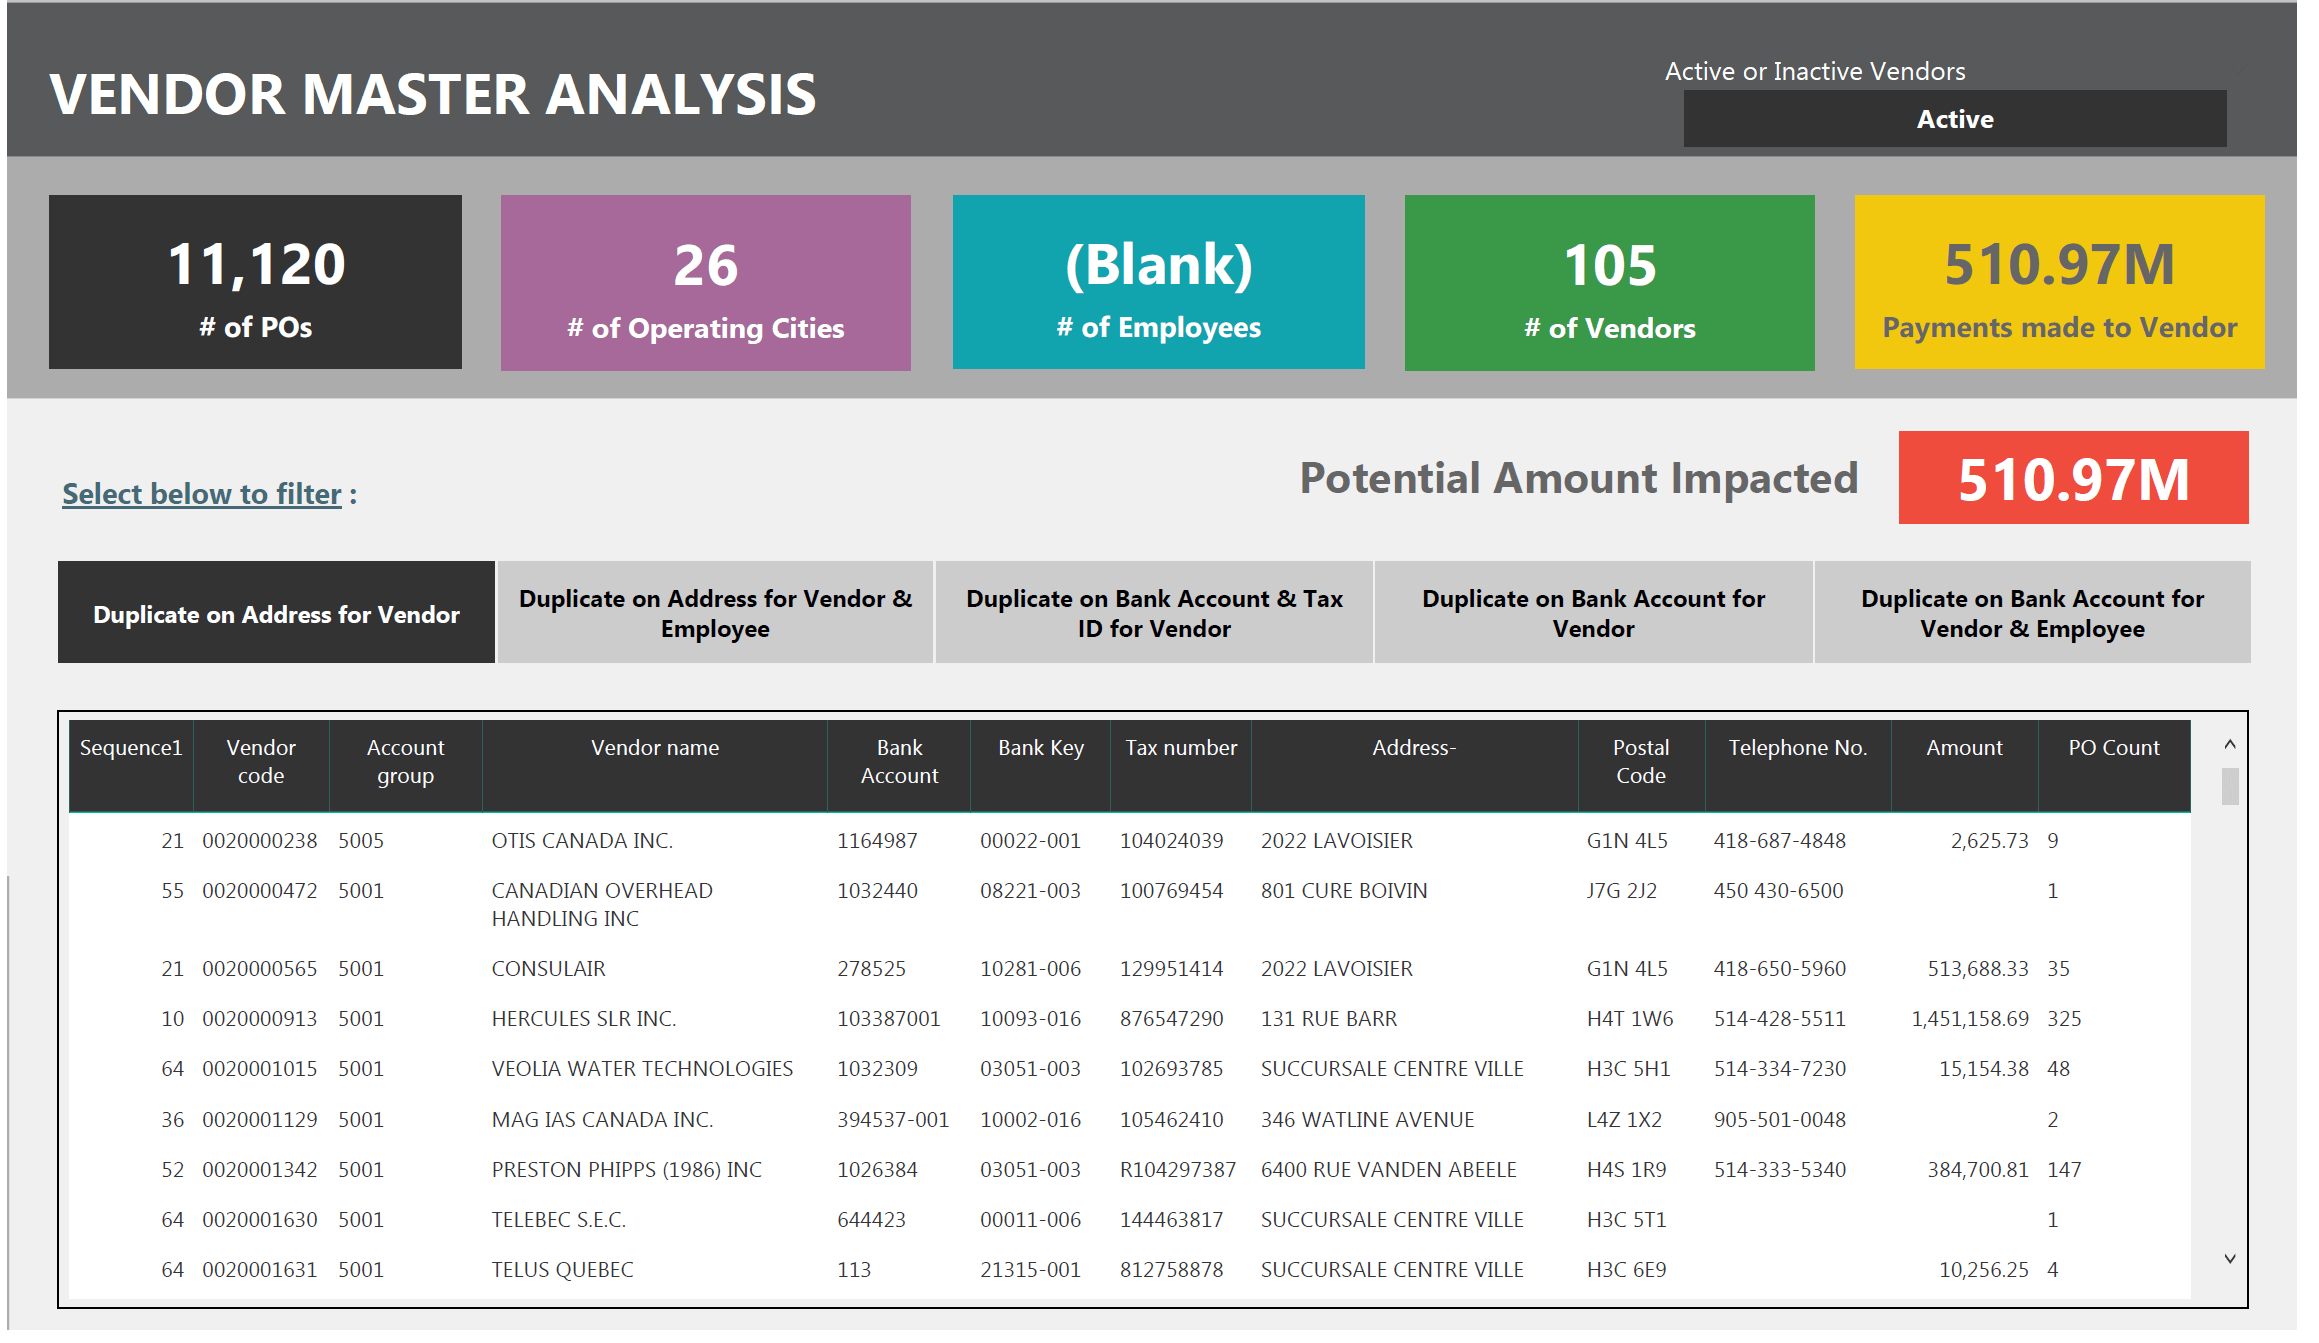
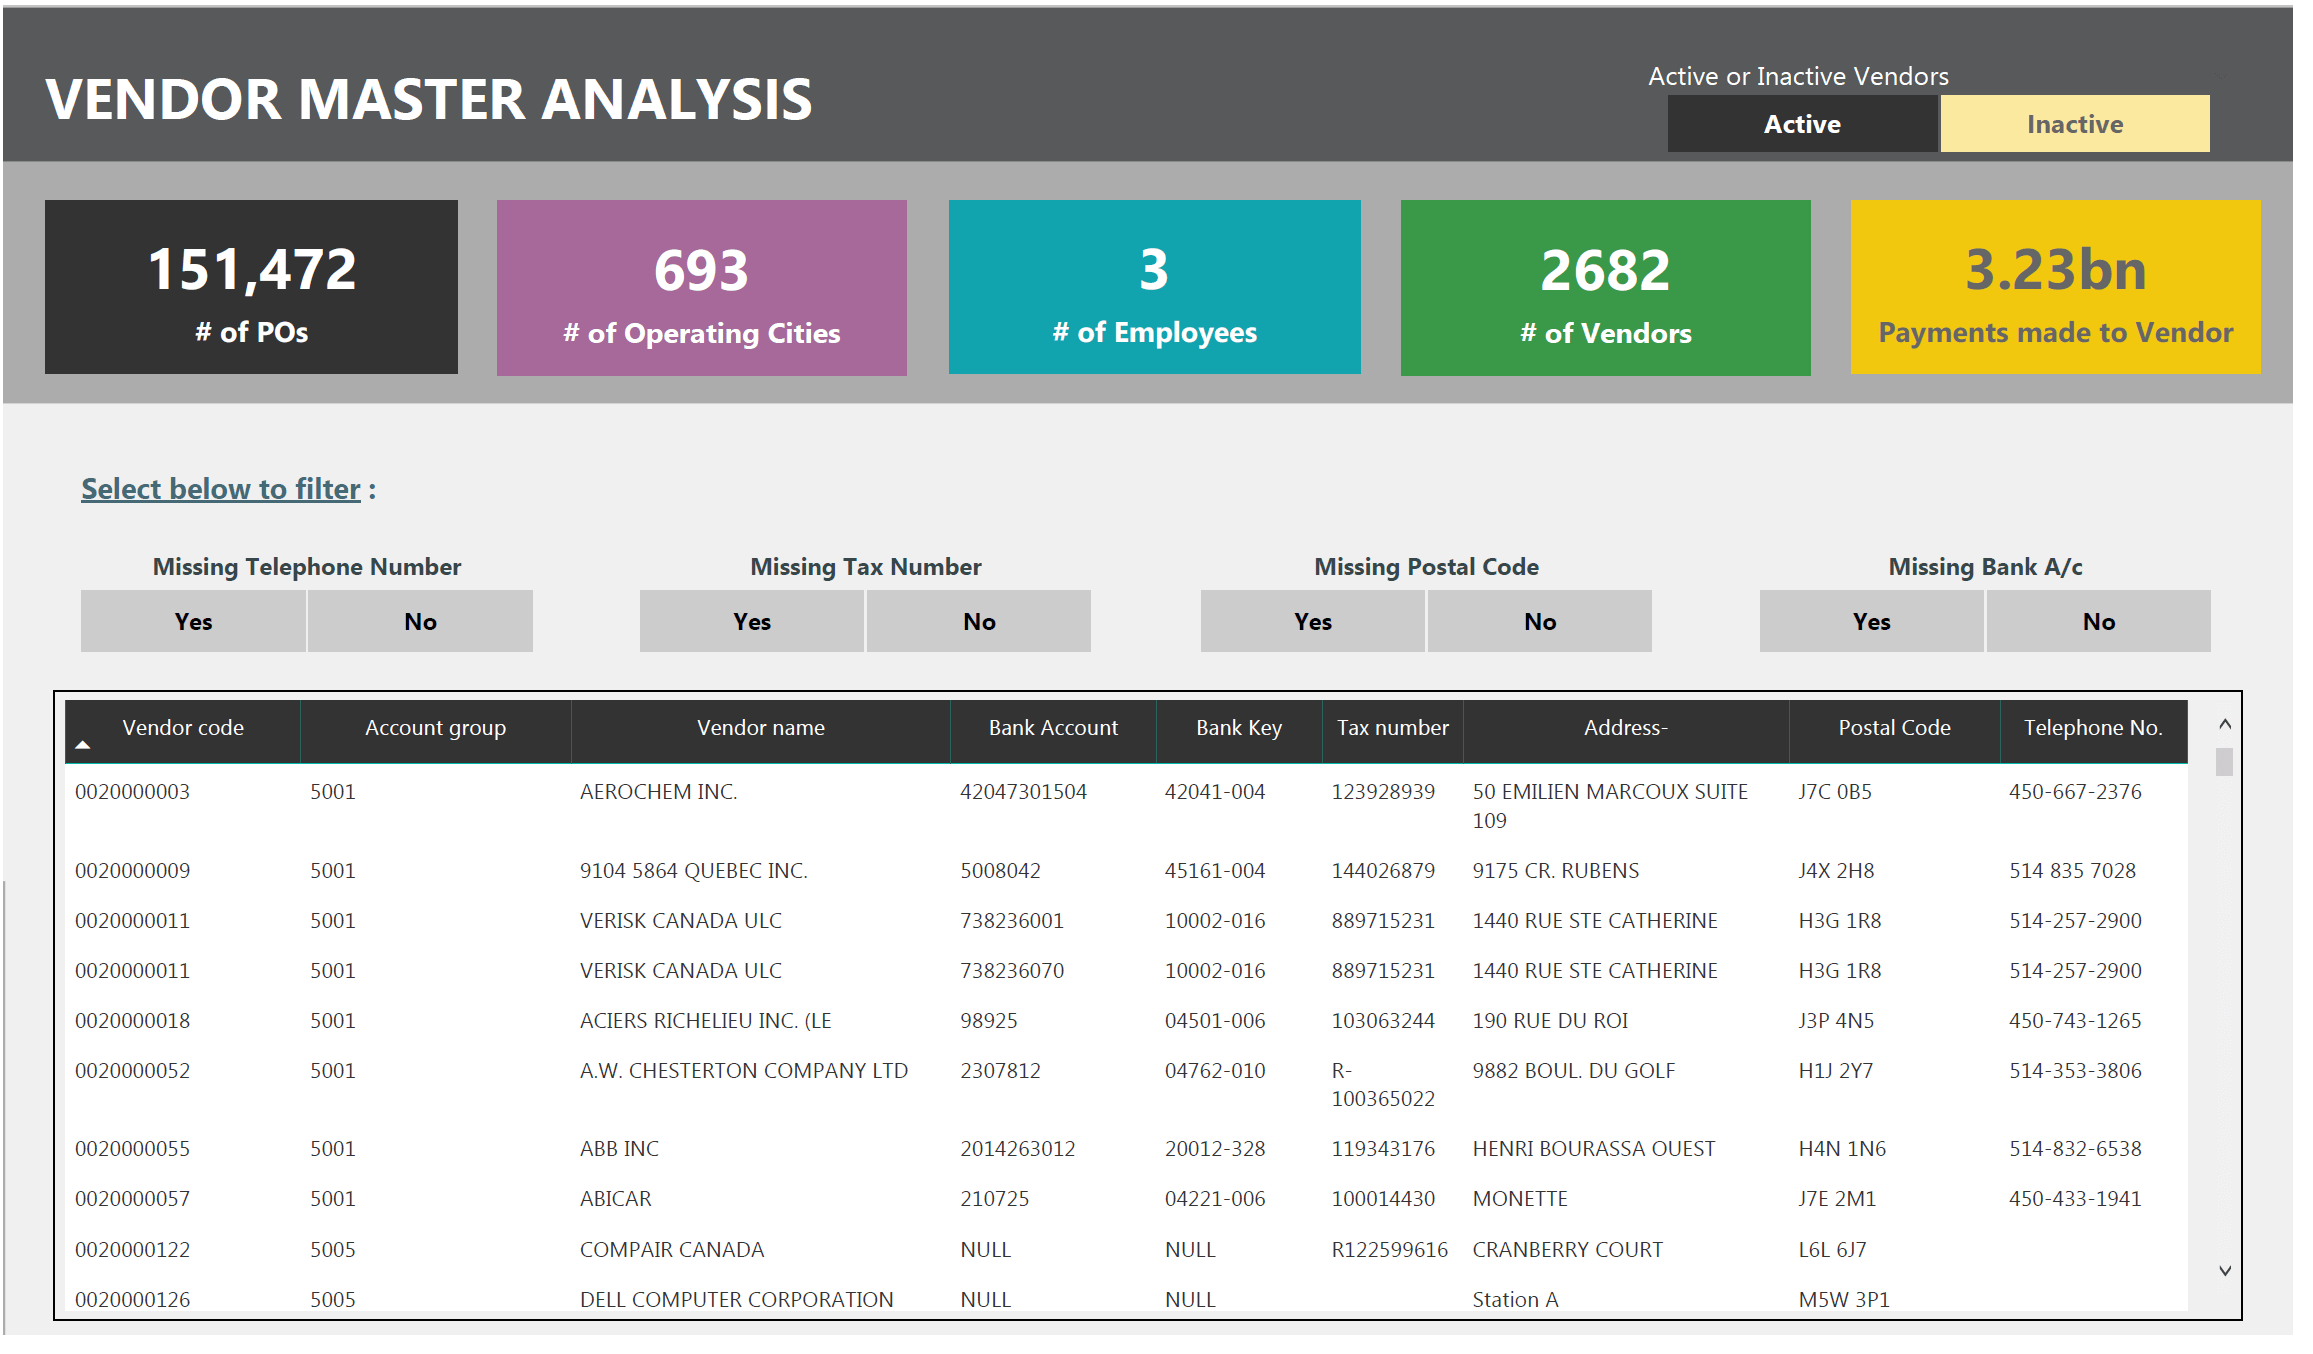
  • Vendor Master Analysis

Connect with an expert to learn how STATXO can be a valuable partner in your journey